library(rpact)
packageVersion("rpact") # version should be version 3.0 or laterHow to Create One- and Multi-Arm Simulation Result Plots with rpact
Utilities
Power simulation
Multi-arm
Preparation
First, load the rpact package
[1] '4.4.0.9305'Simulation results base
Simulation results base - means
maxNumberOfSubjects <- 90
informationRates <- c(0.2, 0.5, 1)
plannedSubjects <- round(informationRates * maxNumberOfSubjects)

getDesignInverseNormal(
    futilityBounds = c(-0.5, 0.5),
    informationRates = informationRates
) |>
  getSimulationMeans(
    groups = 2,
    meanRatio = TRUE,
    thetaH0 = 0.4,
    plannedSubjects = plannedSubjects,
    maxNumberOfIterations = 500,
    allocationRatioPlanned = 3,
    stDev = 1.5,
    seed = 1234567890
) |>
  plot(type = "all", grid = 0)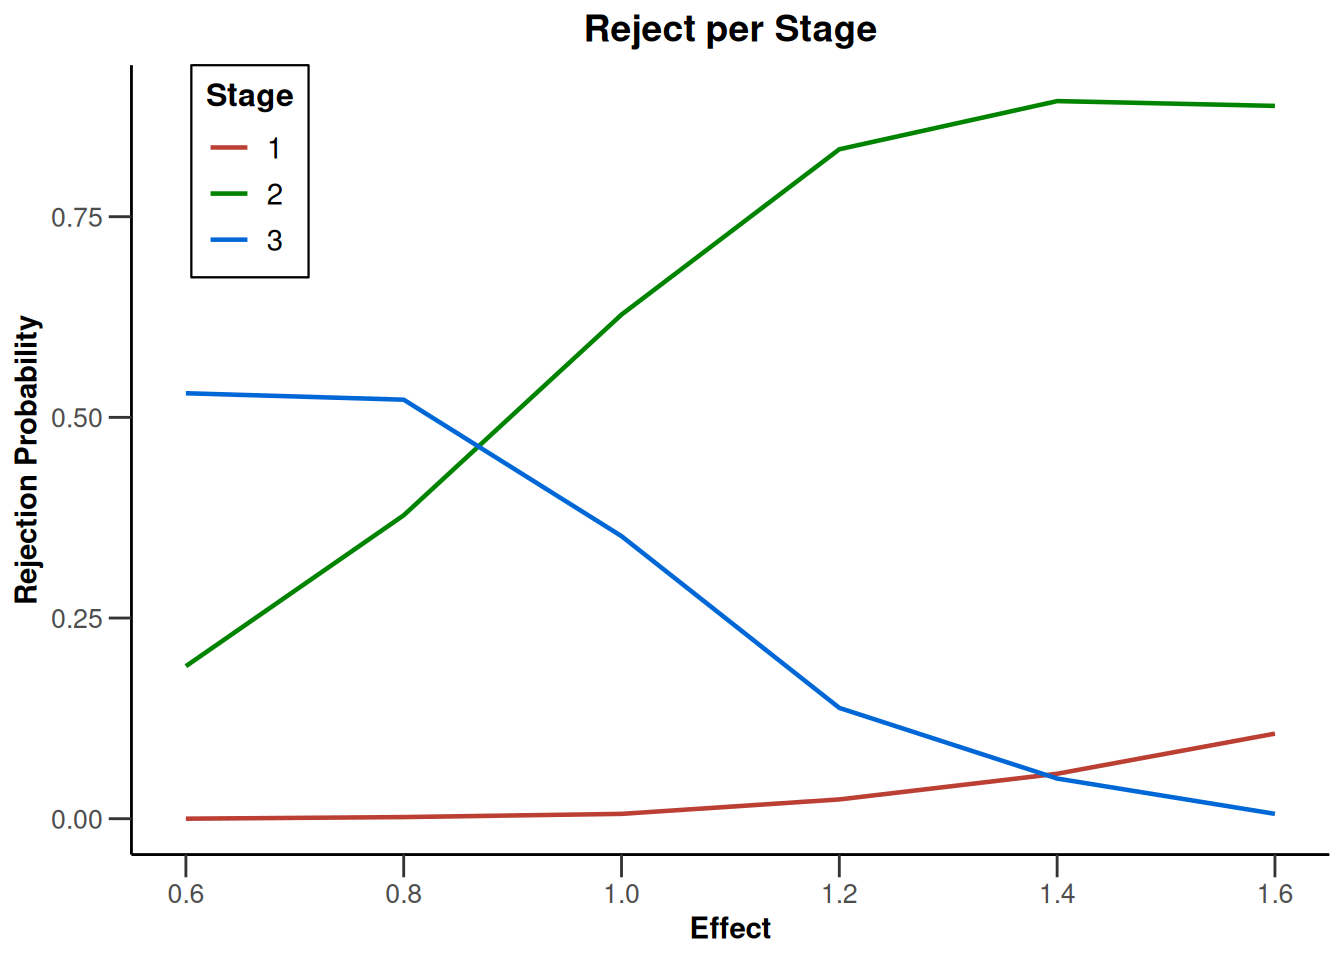
Simulation results base - rates
maxNumberOfSubjects <- 90
informationRates <- (1:3) / 3
plannedSubjects <- round(informationRates * maxNumberOfSubjects)

getDesignInverseNormal(
    futilityBounds = c(-0.5, 0.5),
    informationRates = informationRates
) |>
  getSimulationRates(
    groups = 2,
    riskRatio = TRUE,
    thetaH0 = 0.8,
    plannedSubjects = plannedSubjects,
    maxNumberOfIterations = 500,
    allocationRatioPlanned = 3,
    seed = 1234567890
) |>
  plot(type = "all", grid = 0)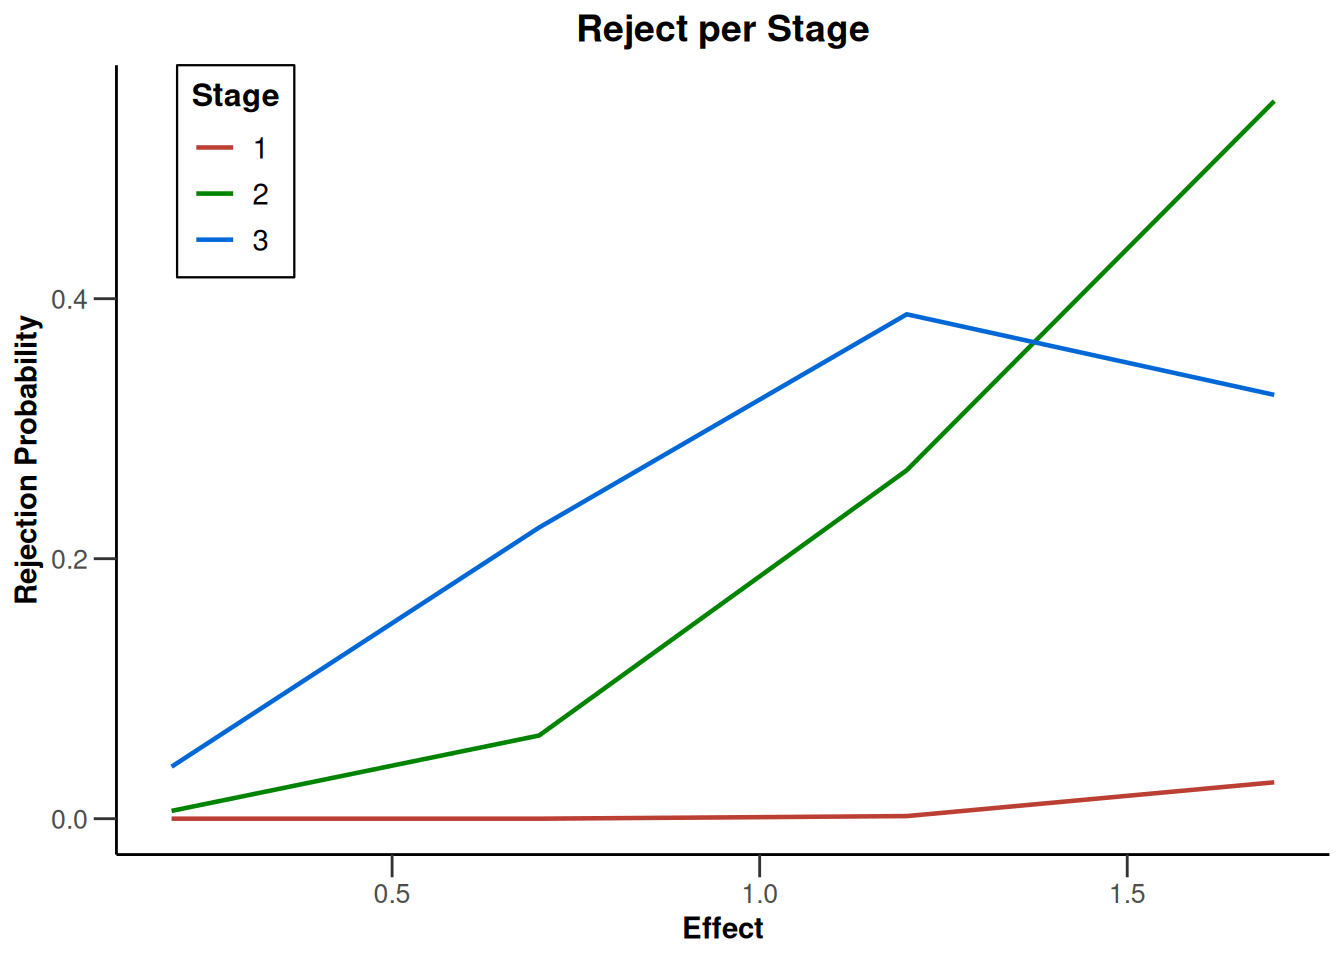
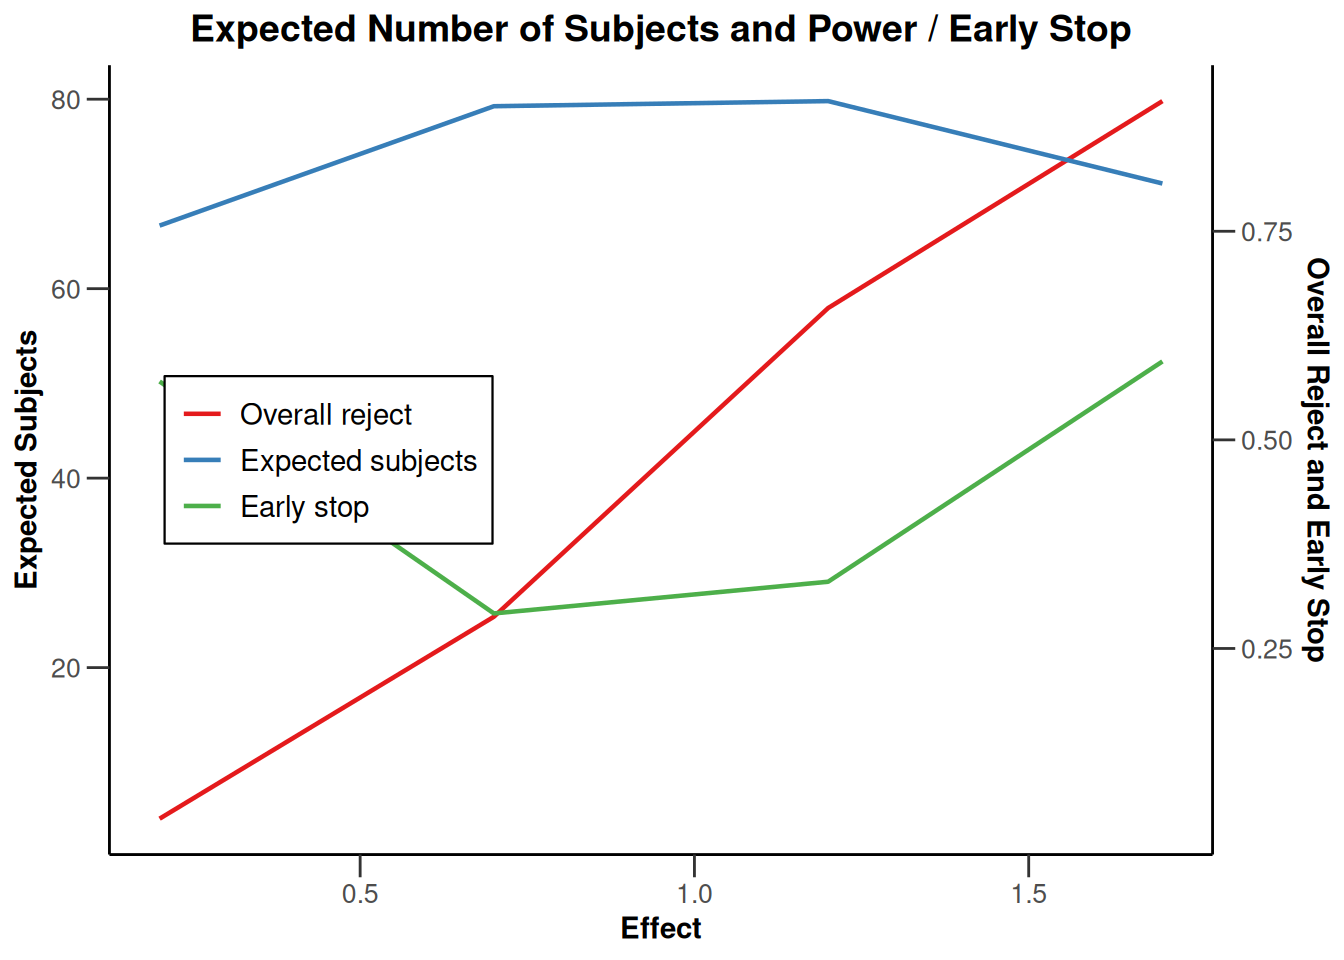
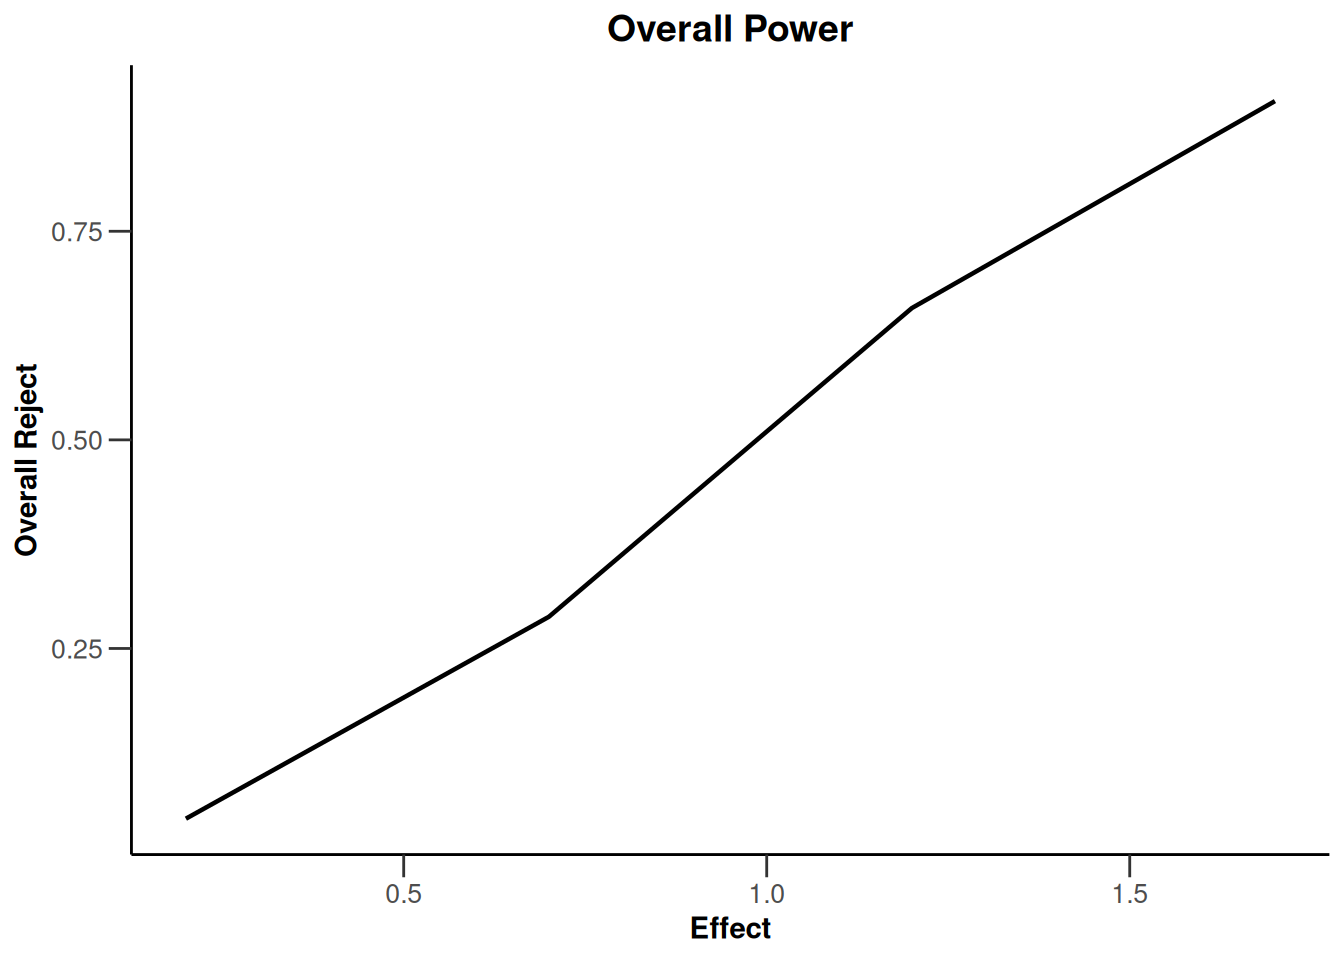
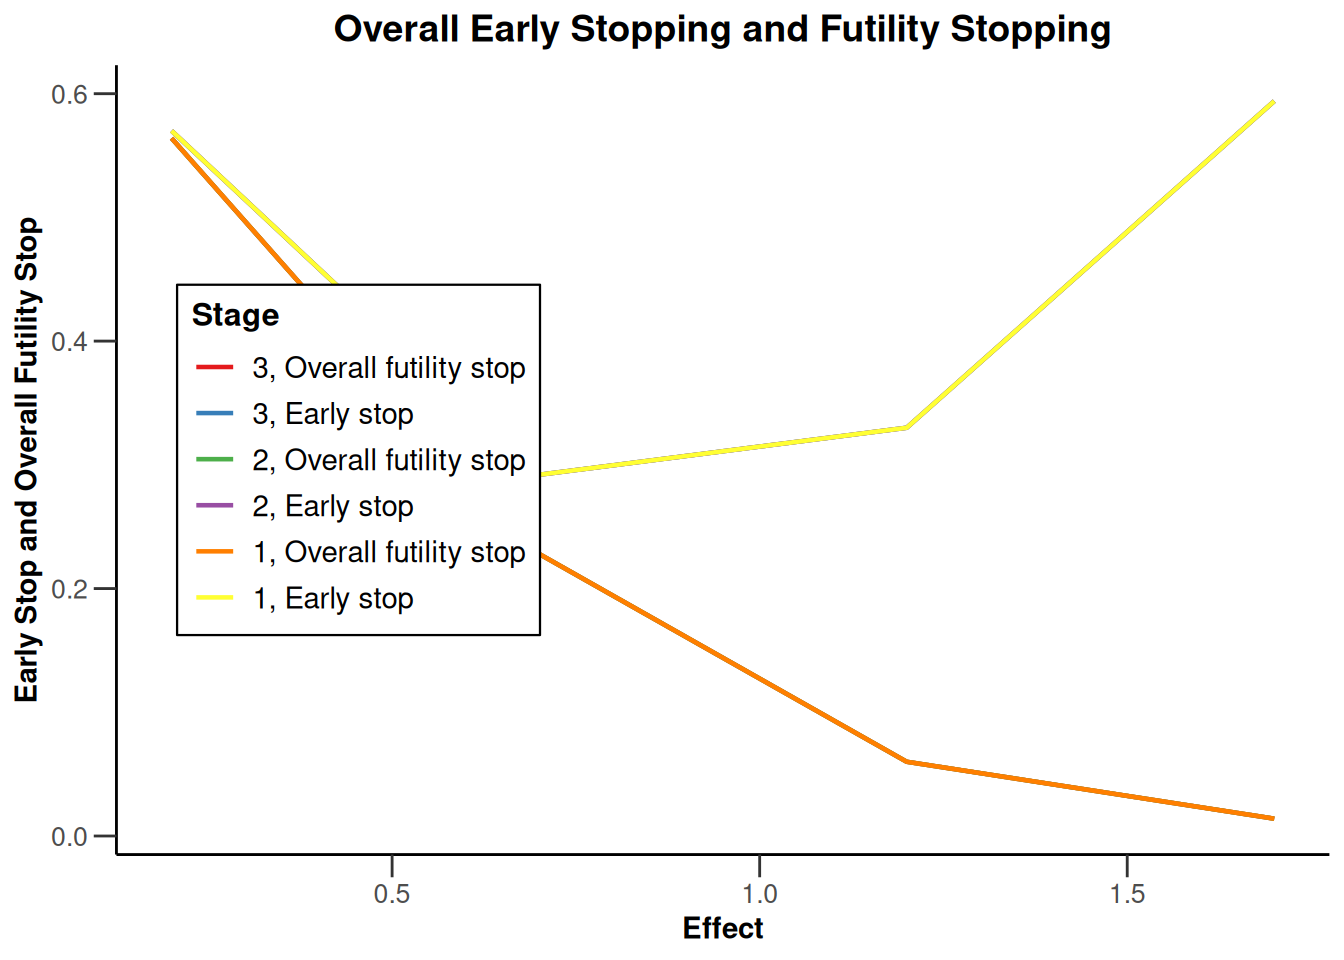
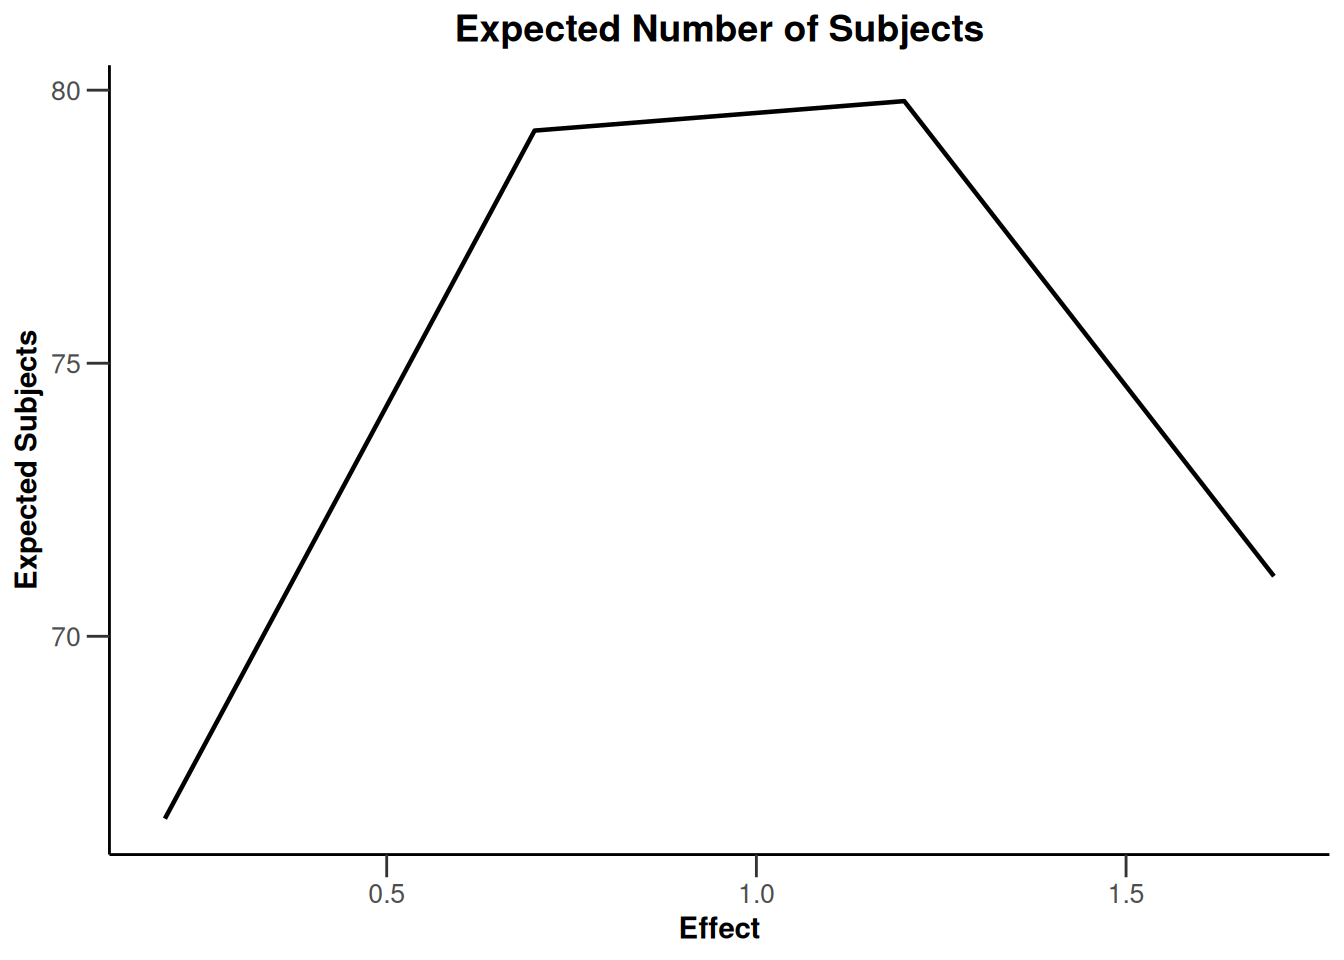
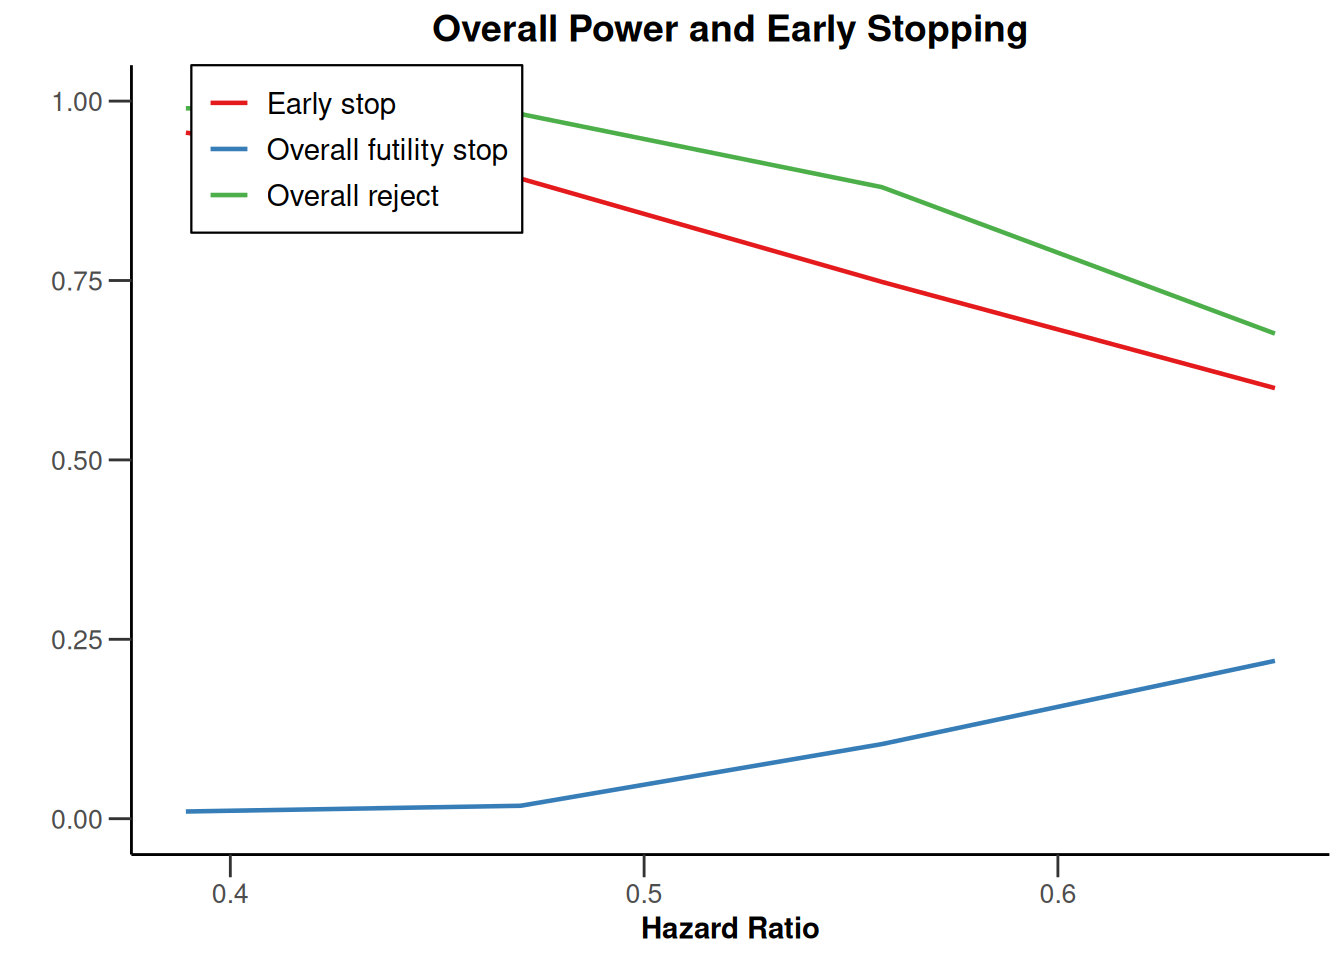
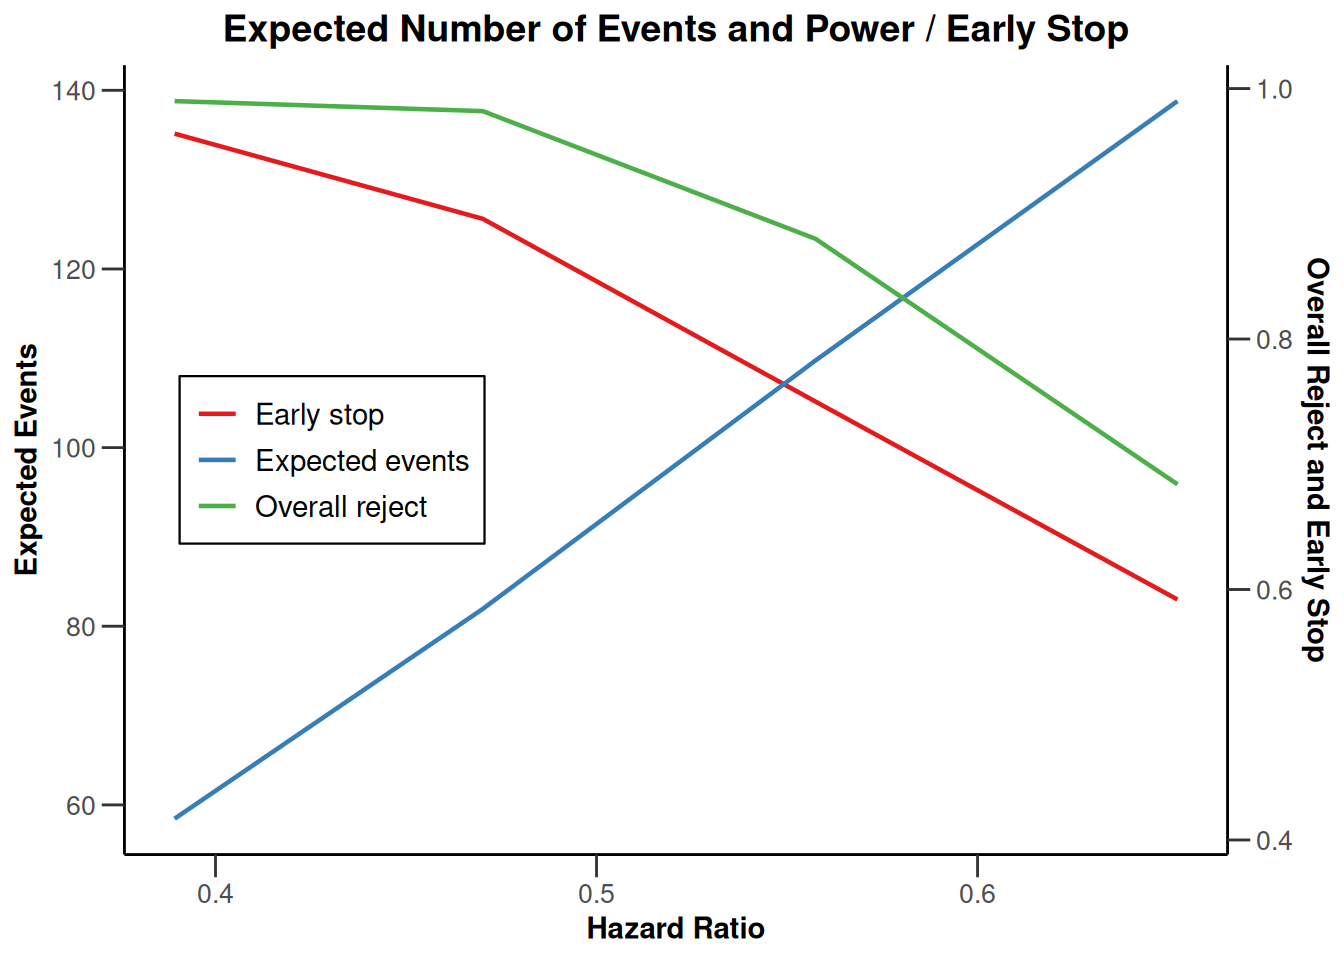
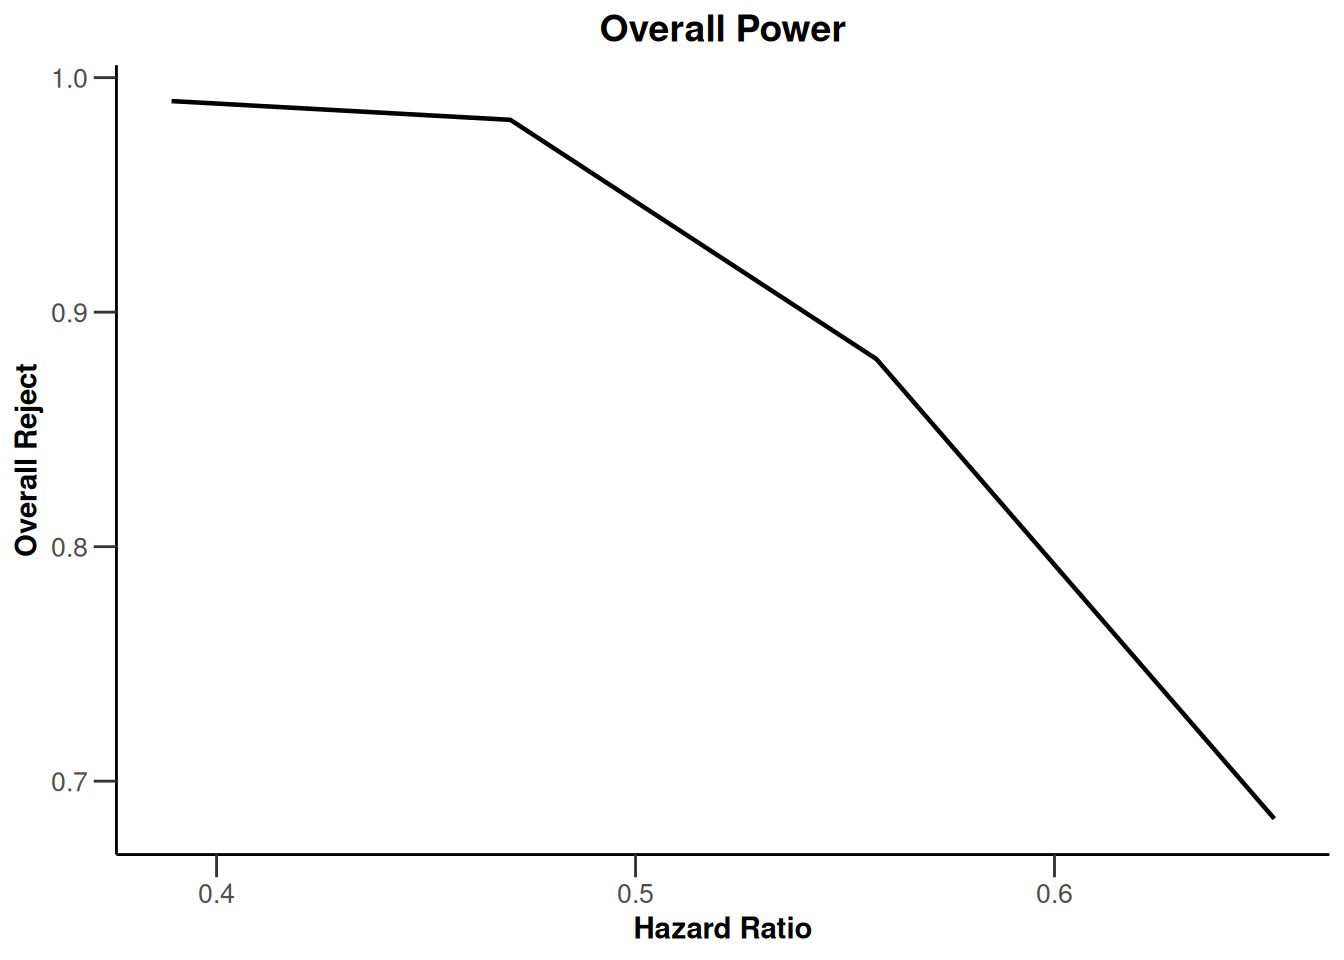
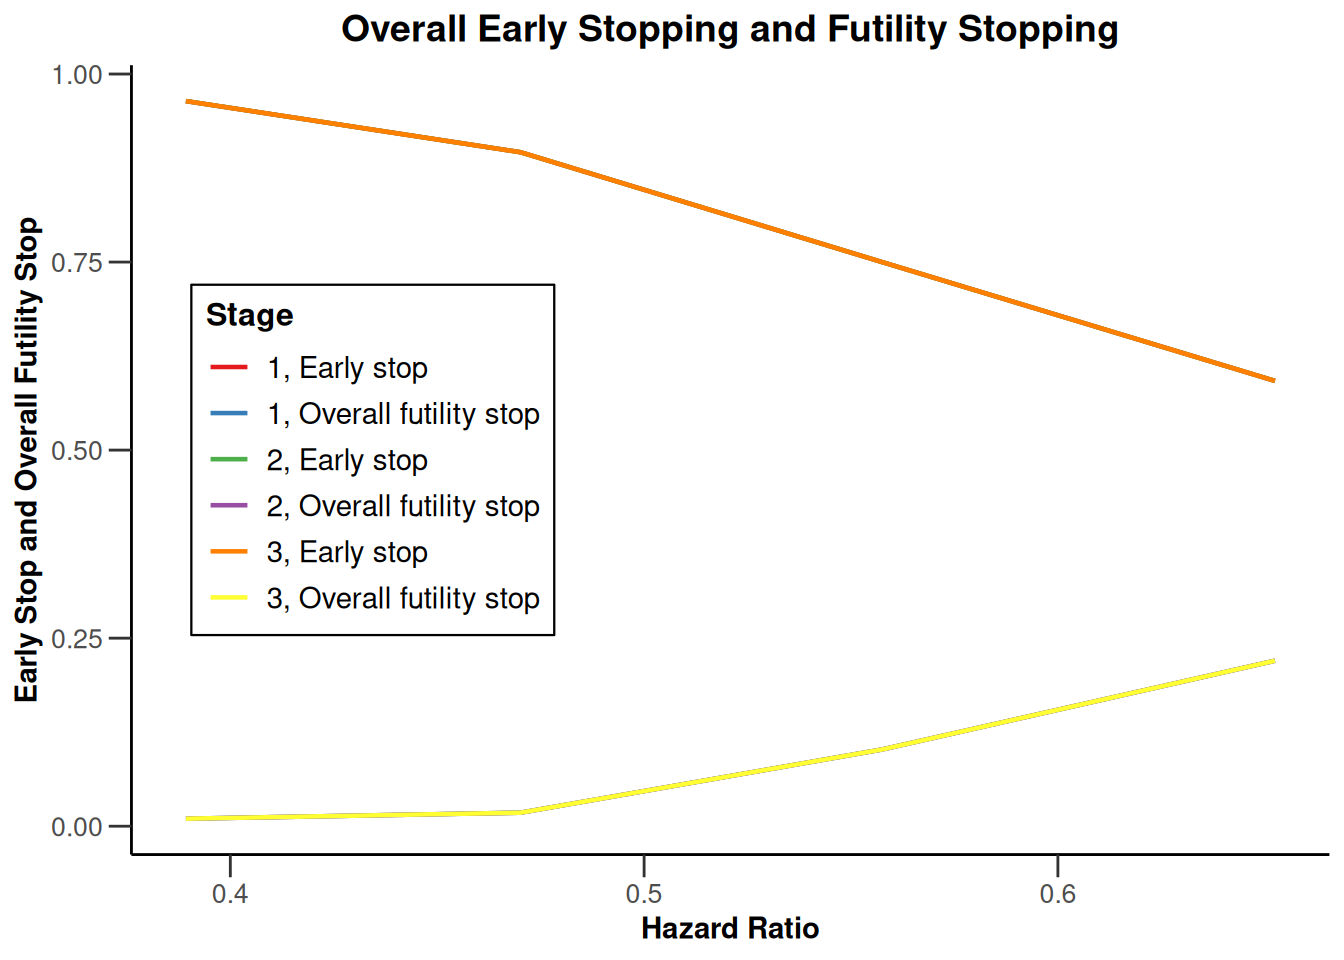
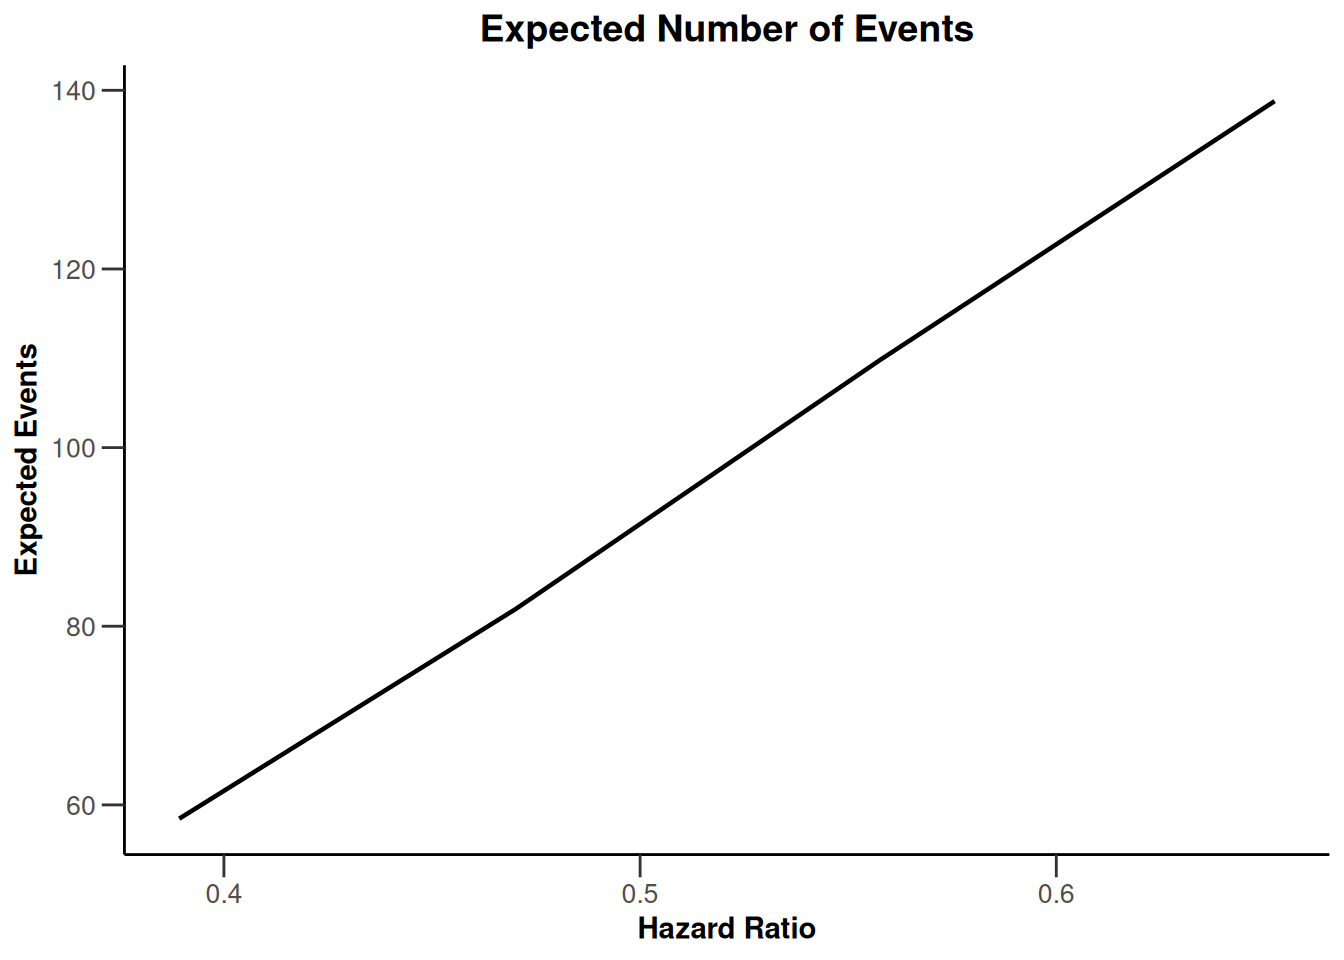
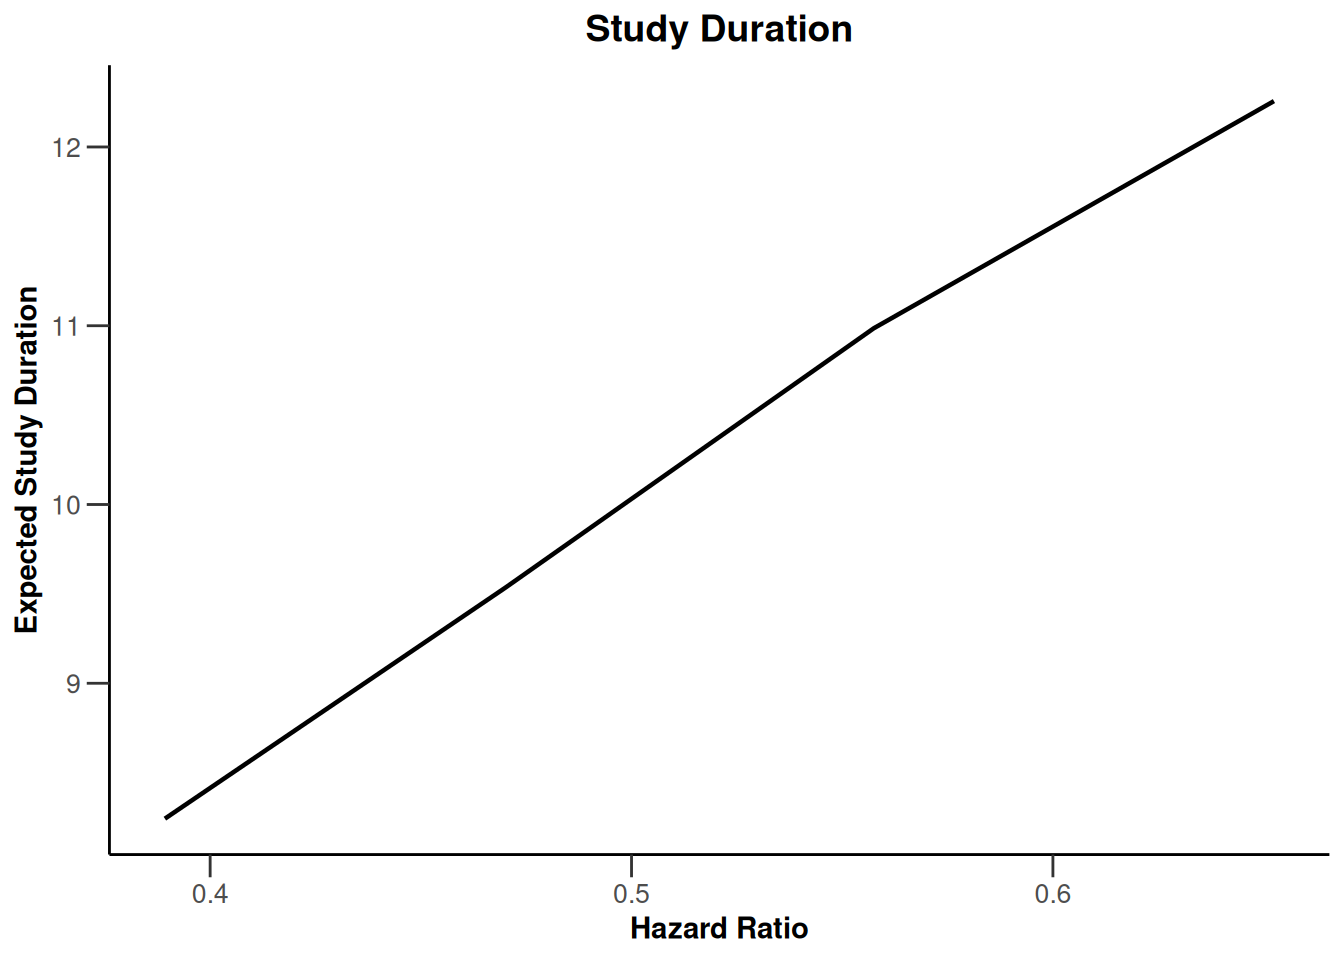
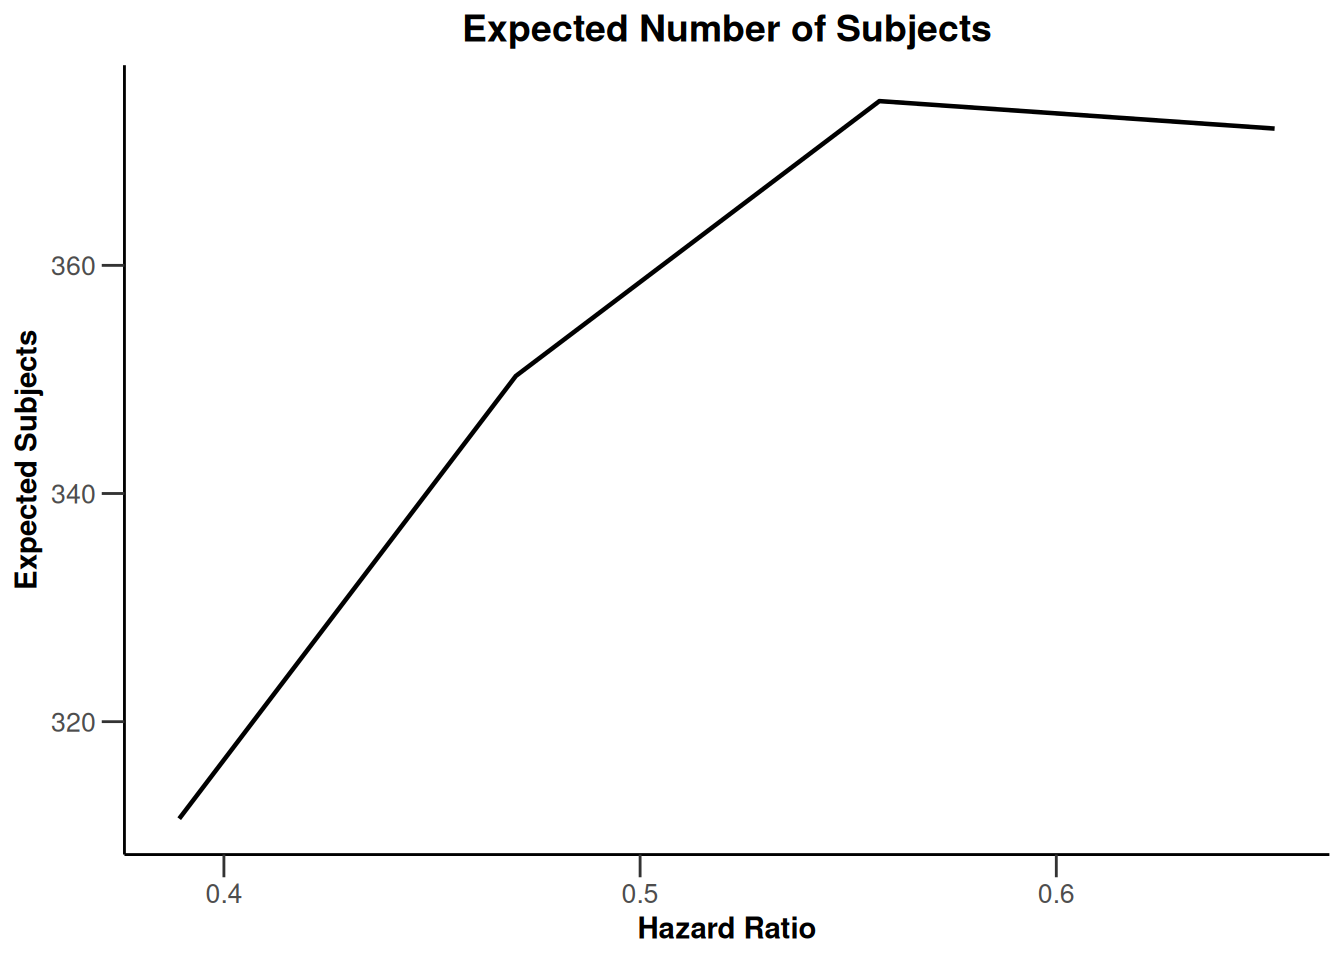
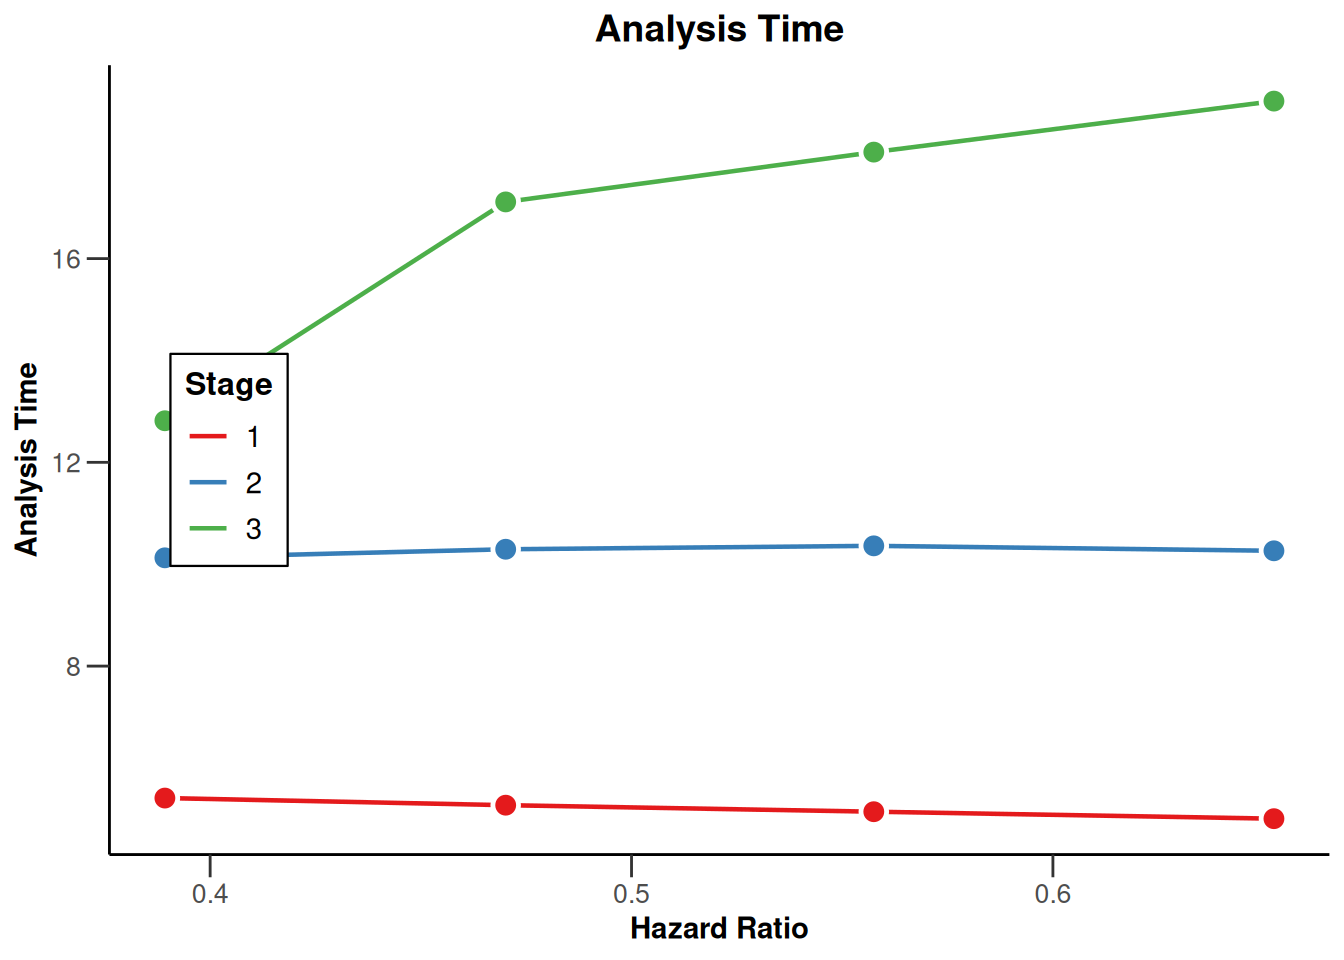
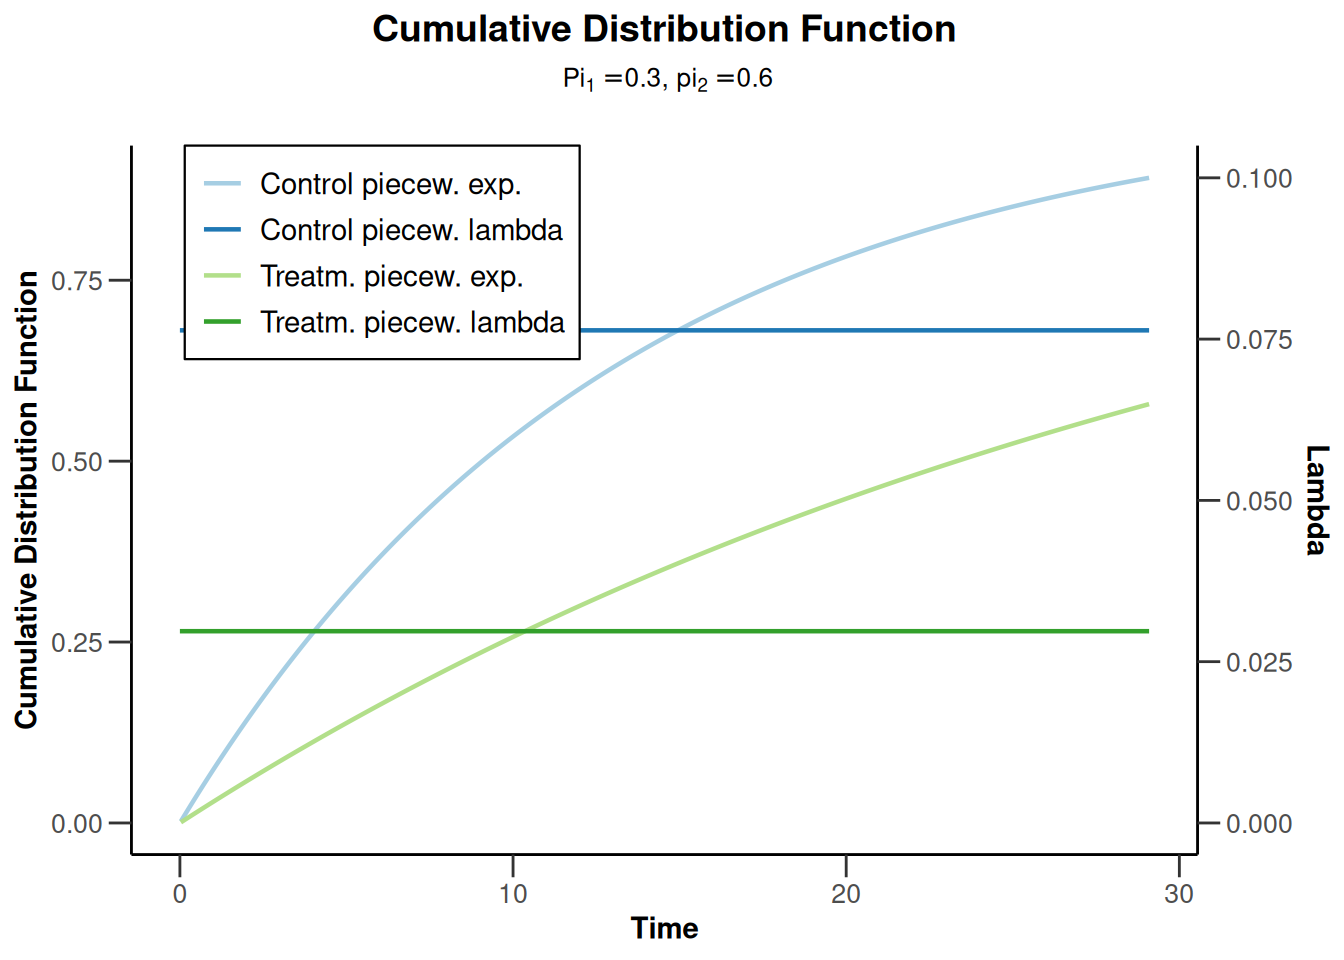
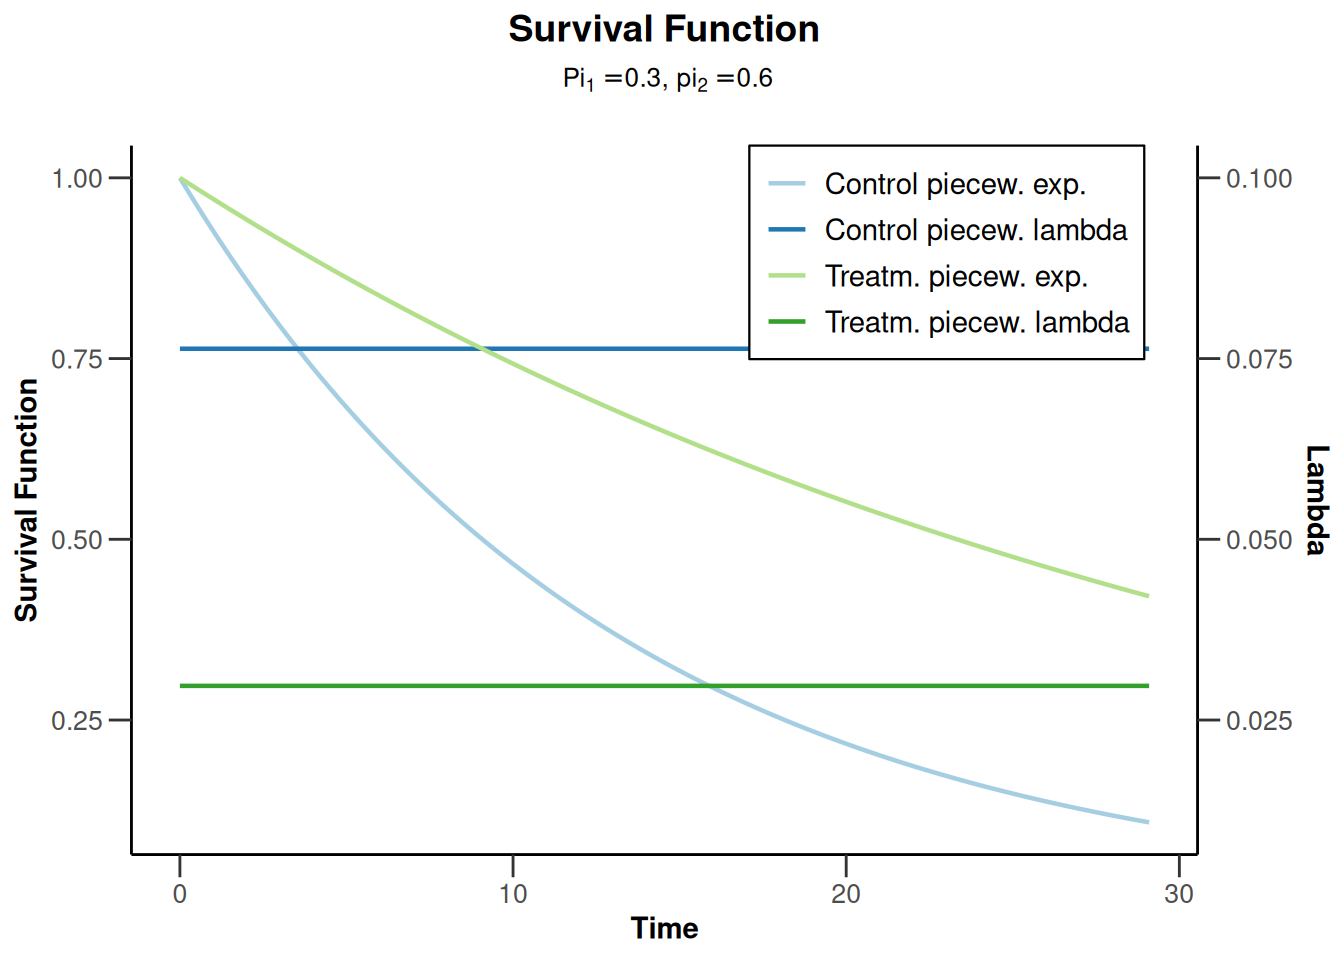
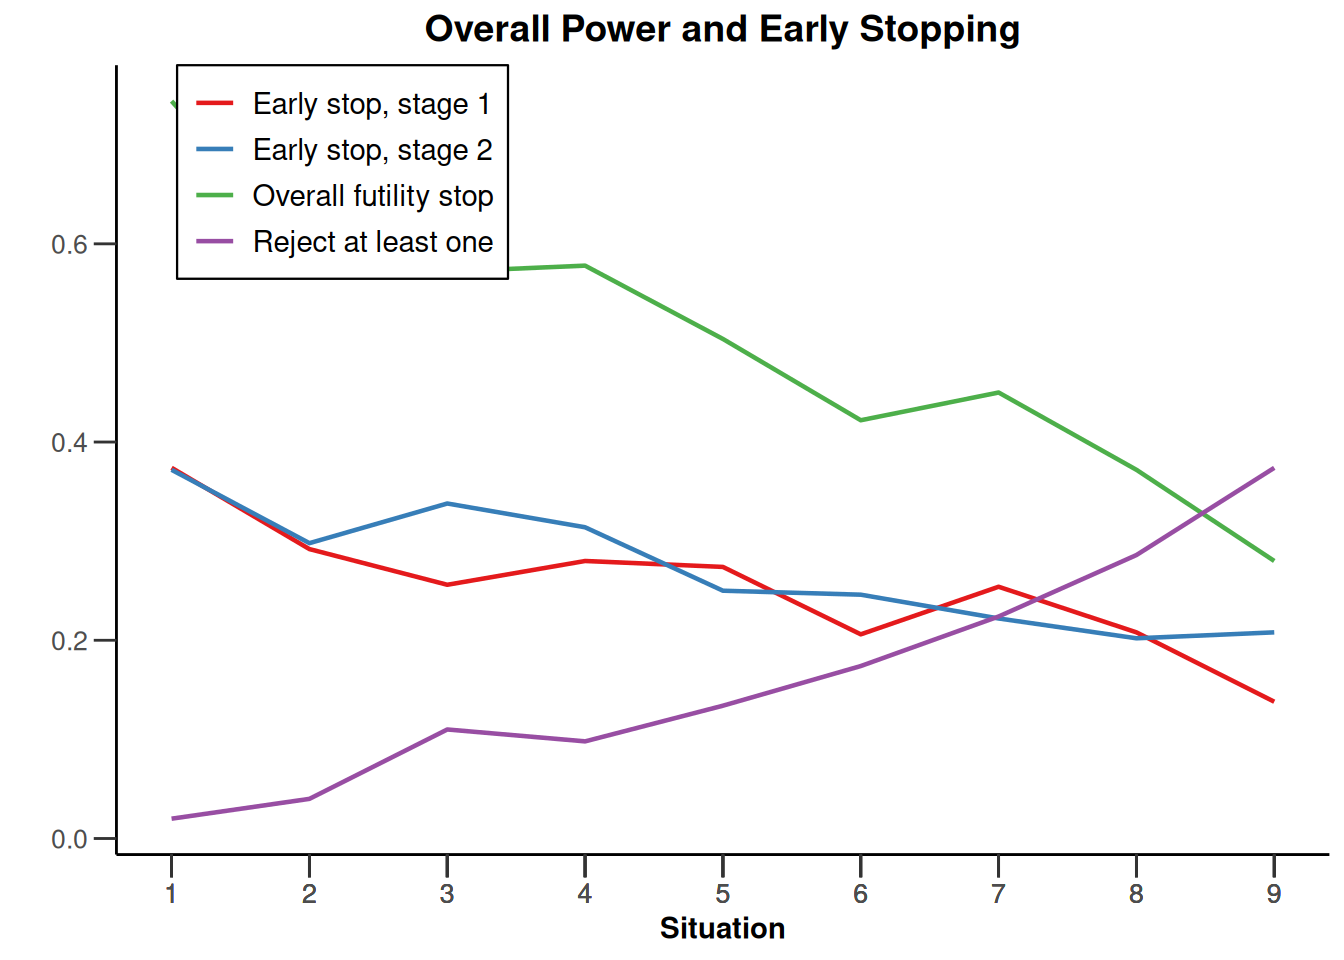
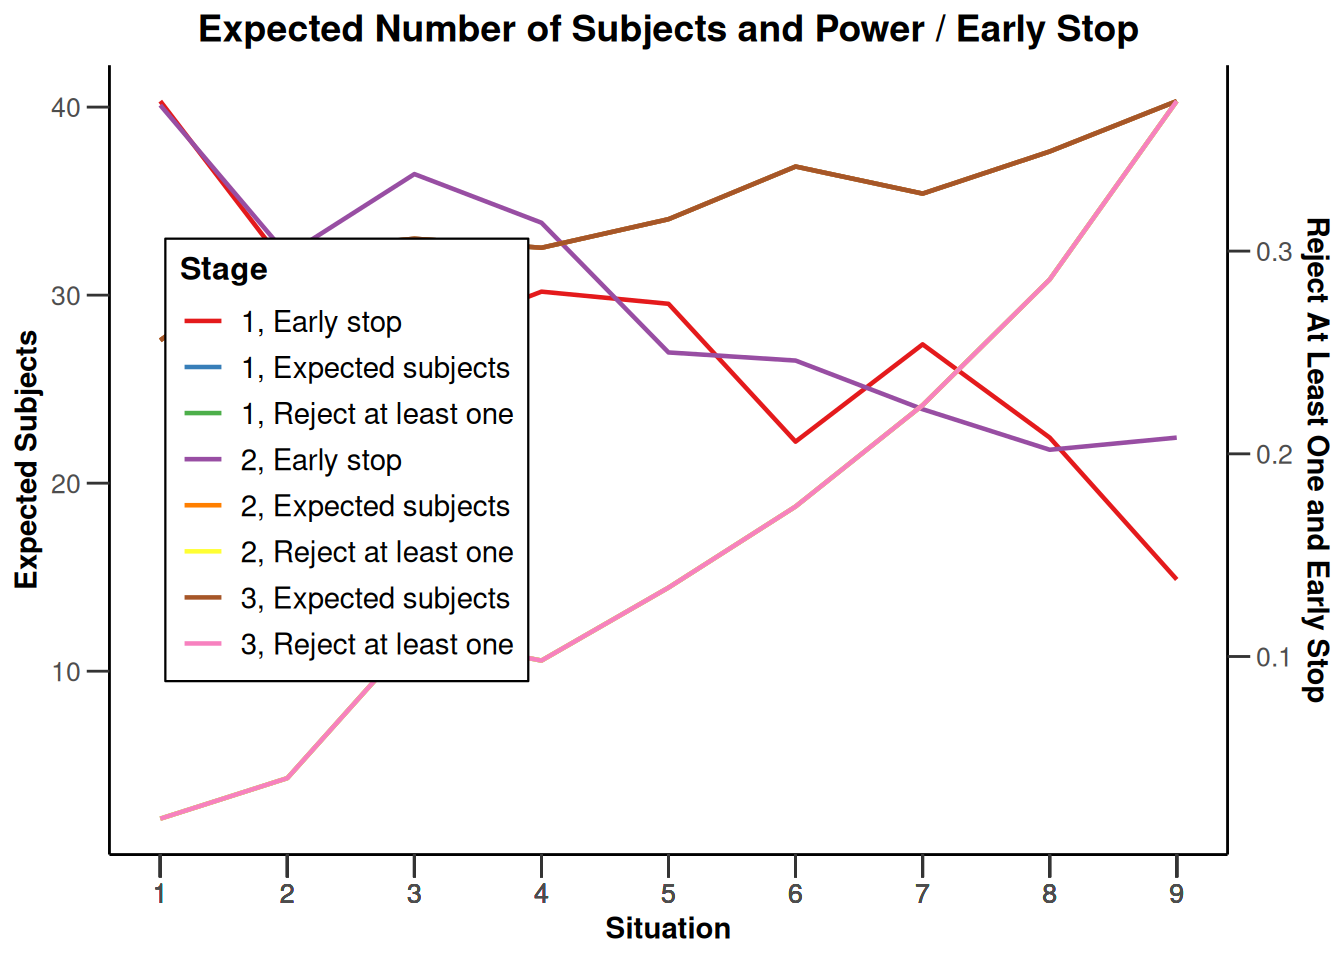
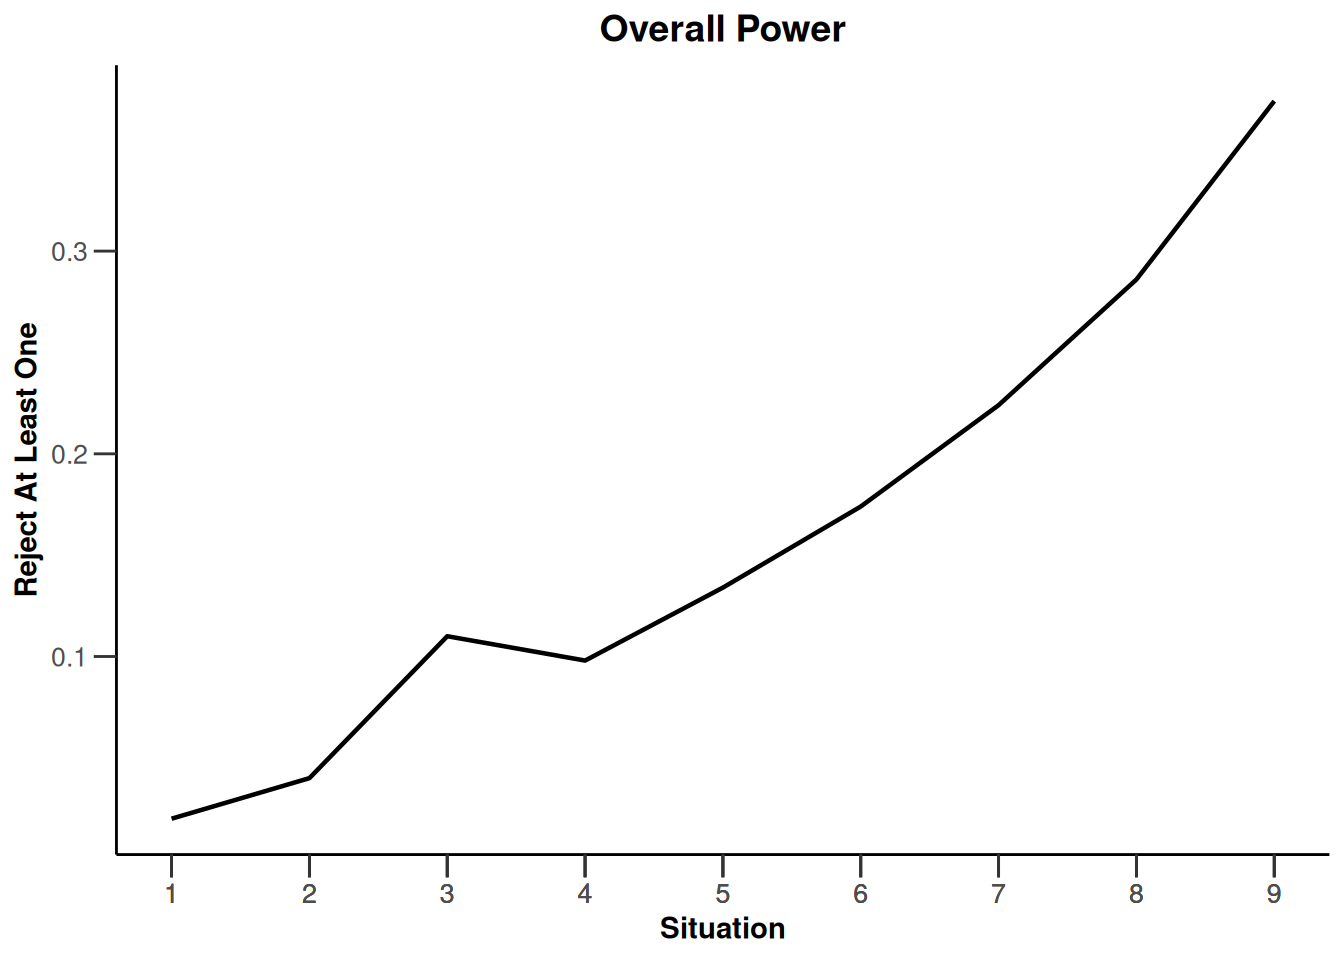
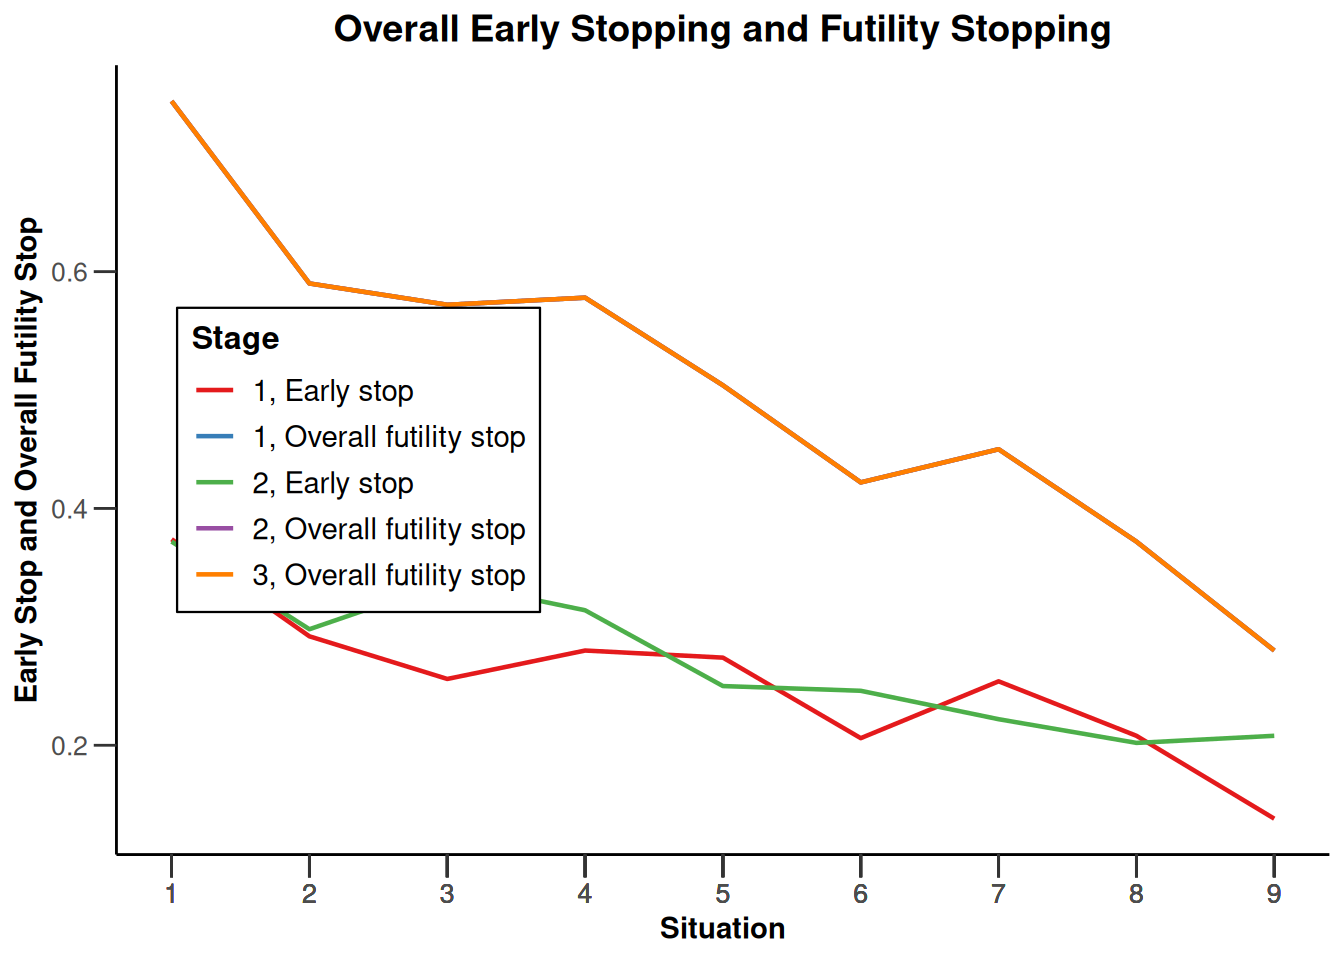
Simulation results base - survival
kMax <- 3
getDesignFisher(
  kMax = kMax,
  alpha0Vec = c(0.5, 0.5)
) |>
  getSimulationSurvival(
    pi2 = 0.6,
    pi1 = seq(0.3, 0.45, 0.05),
    directionUpper = FALSE,
    maxNumberOfSubjects = 500,
    plannedEvents = (1:kMax) * 20,
    allocation1 = 1,
    allocation2 = 1,
    accrualTime = c(0, 3, 6, 12),
    accrualIntensity = c(0.1, 0.2, 0.2),
    dropoutRate1 = 0,
    dropoutRate2 = 0,
    dropoutTime = 12,
    conditionalPower = 0.8,
    minNumberOfEventsPerStage = c(NA_real_, 10, 10),
    maxNumberOfEventsPerStage = c(NA_real_, 100, 200),
    maxNumberOfIterations = 500,
    seed = 1234567890
) |>
  plot(type = "all", grid = 0)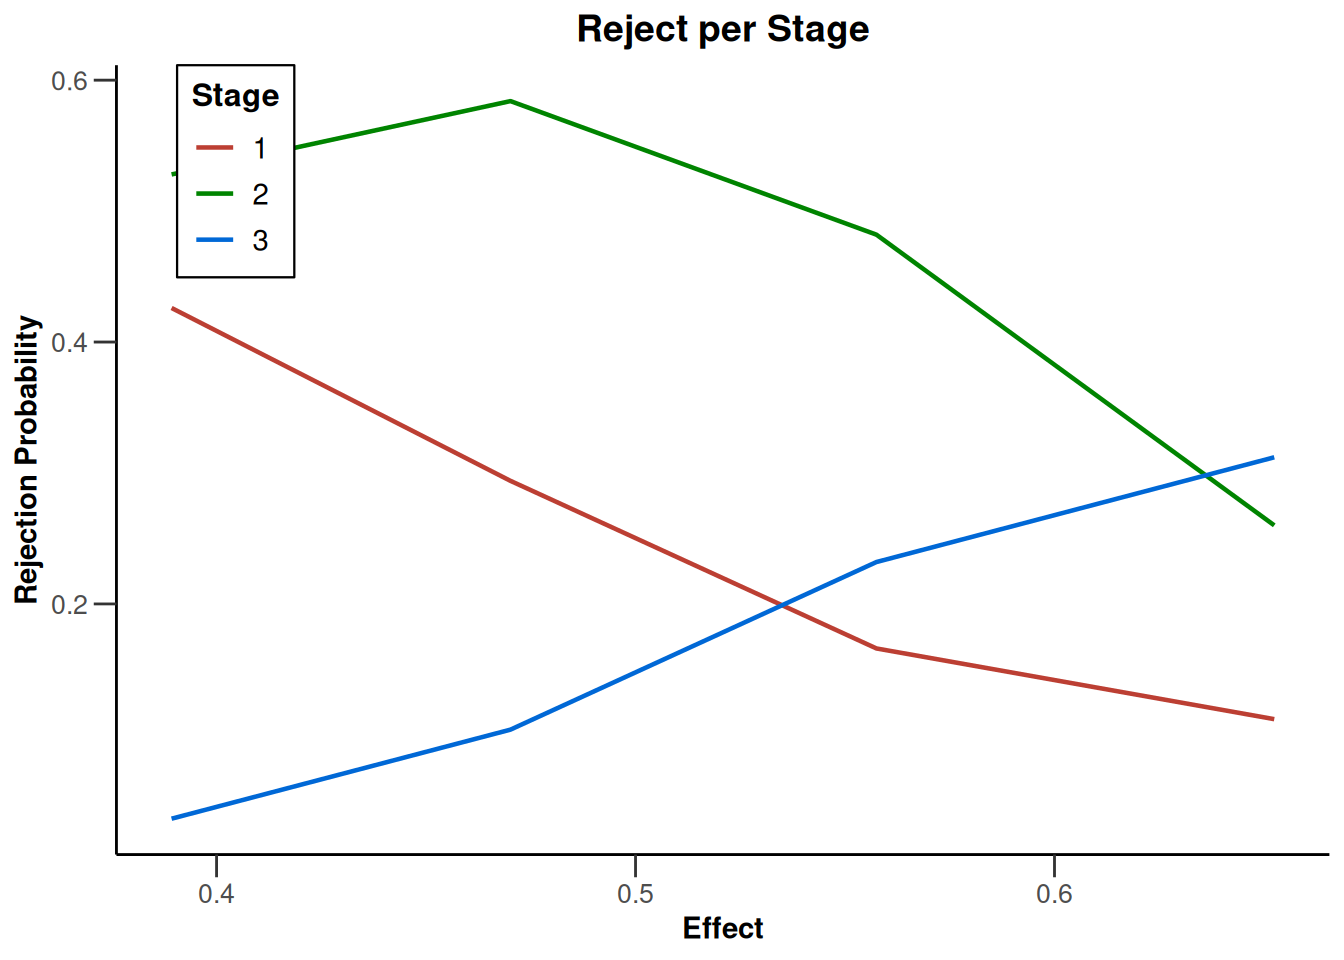
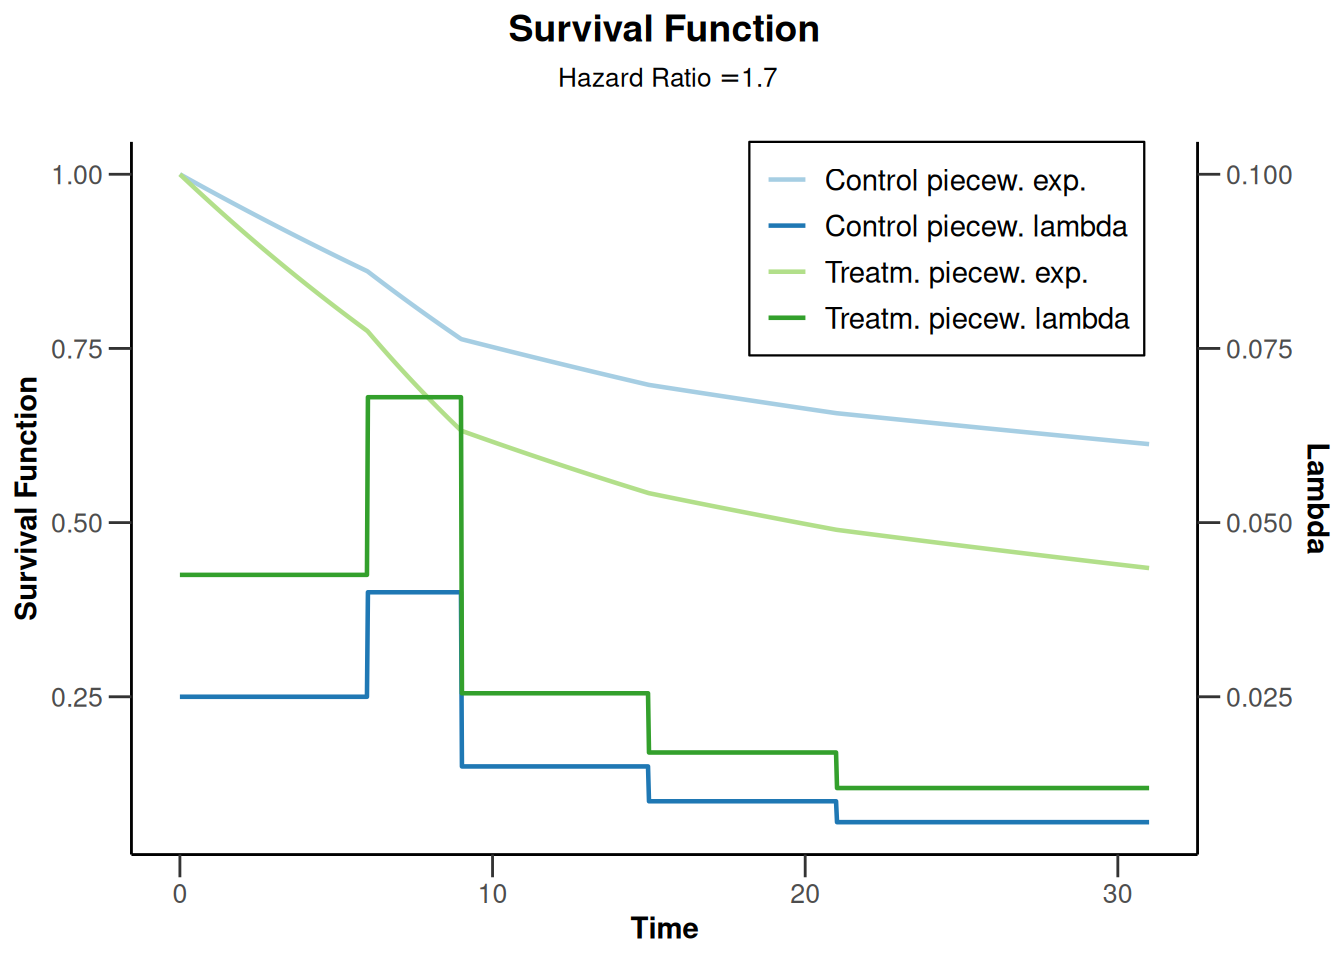
piecewiseSurvivalTime <- list(
    "<6" = 0.025,
    "6 - <9" = 0.04,
    "9 - <15" = 0.015,
    "15 - <21" = 0.01,
    ">=21" = 0.007
)

kMax <- 3
getDesignGroupSequential(
  kMax = kMax,
  typeOfDesign = "WT",
  deltaWT = 0.25
) |>
  getSimulationSurvival(
    directionUpper = TRUE,
    maxNumberOfSubjects = 500,
    plannedEvents = (1:kMax) * 20,
    allocation1 = 1,
    allocation2 = 1,
    accrualTime = c(0, 3, 6, 12),
    piecewiseSurvivalTime = piecewiseSurvivalTime,
    hazardRatio = 1.7,
    accrualIntensity = c(0.1, 0.2, 0.2),
    dropoutRate1 = 0,
    dropoutRate2 = 0,
    dropoutTime = 12,
    conditionalPower = 0.8,
    minNumberOfEventsPerStage = c(NA_real_, 10, 10),
    maxNumberOfEventsPerStage = c(NA_real_, 100, 200),
    maxNumberOfIterations = 500,
    seed = 1234567890
) |>
  plot(type = "all", grid = 0)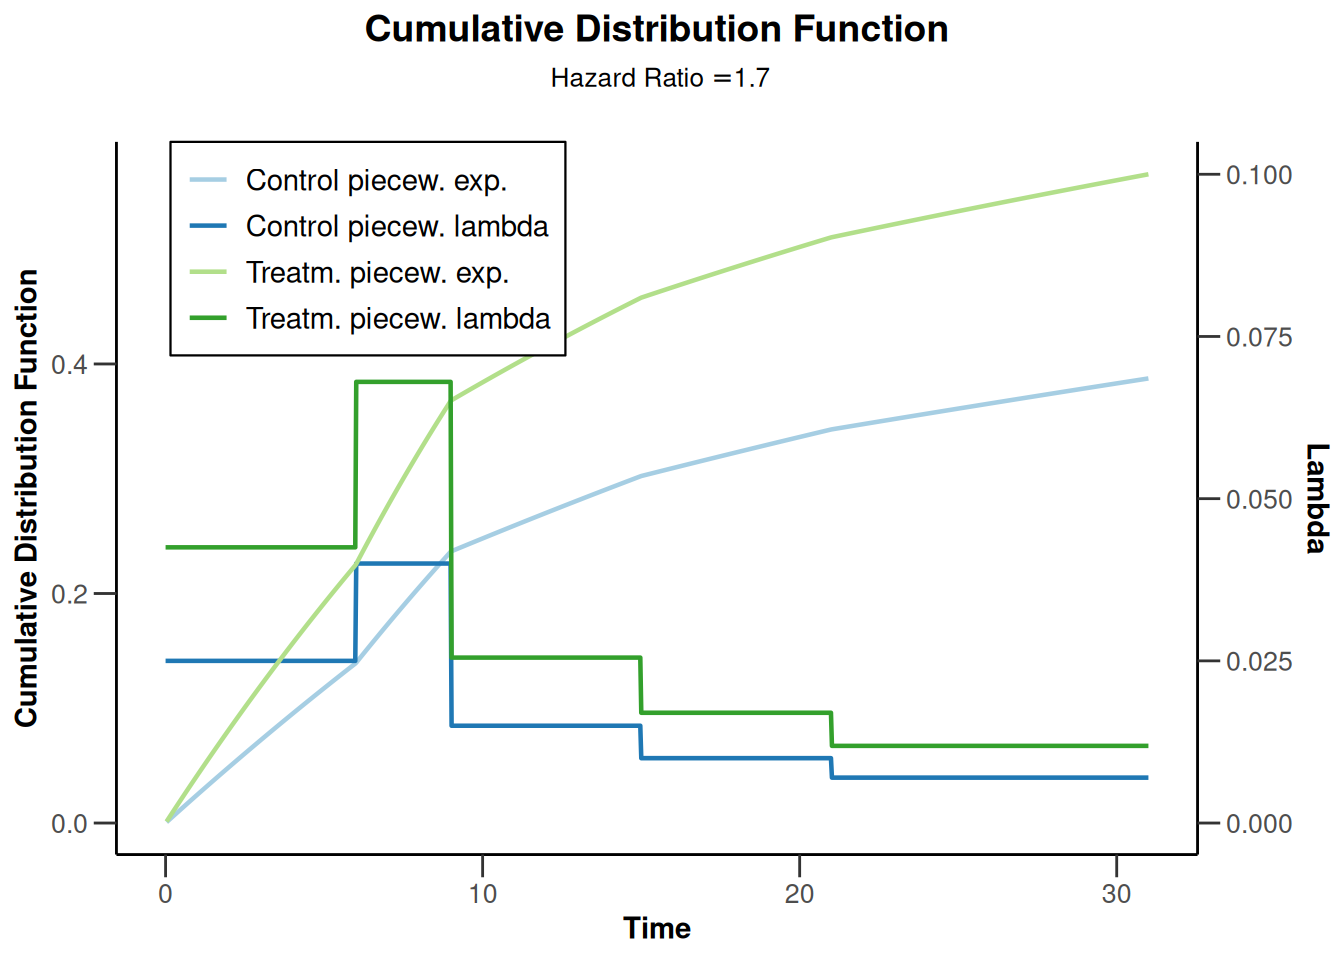
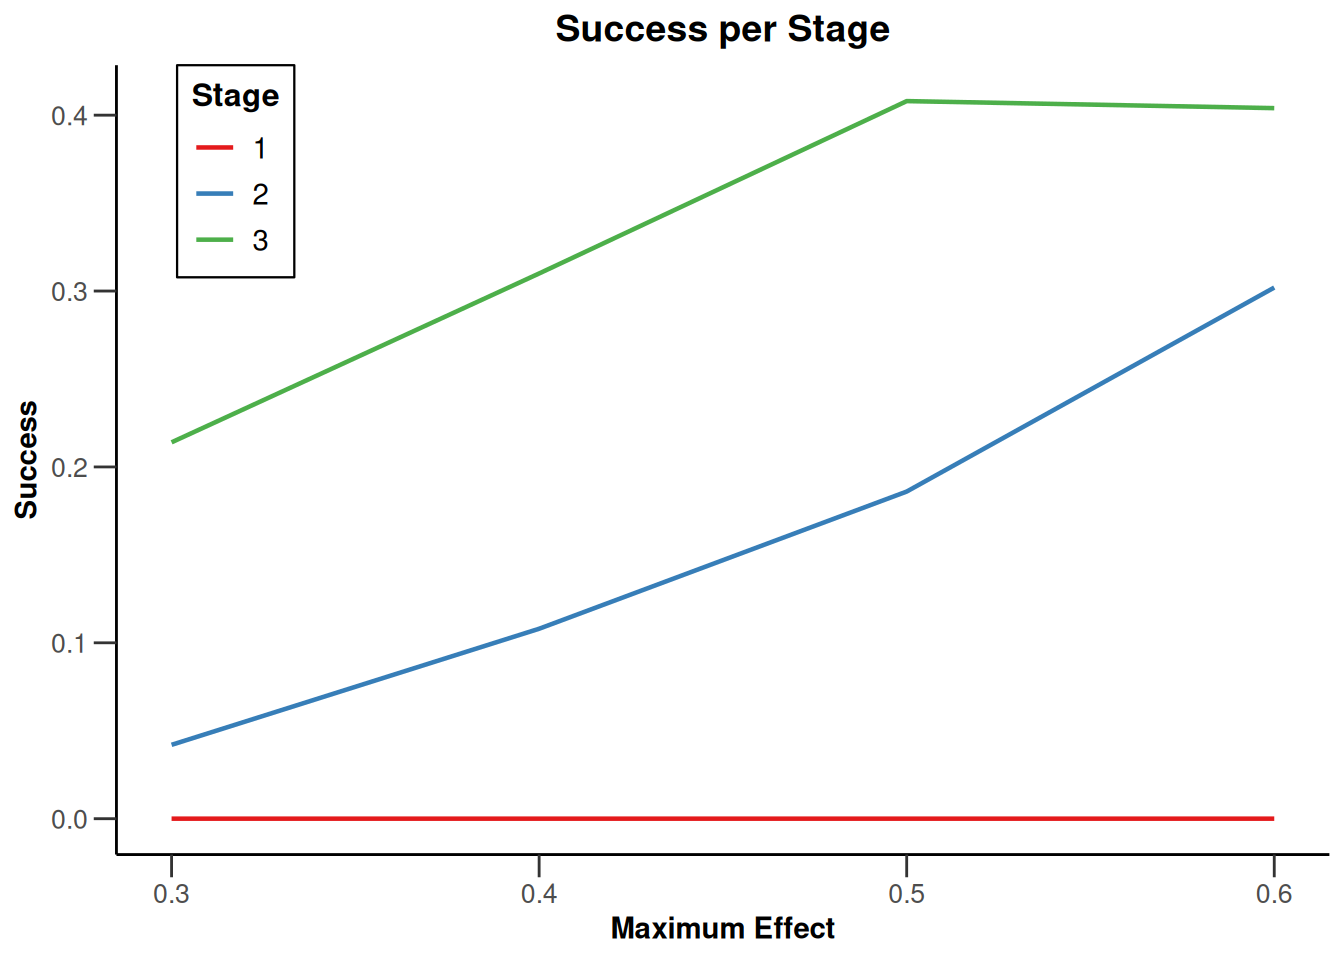
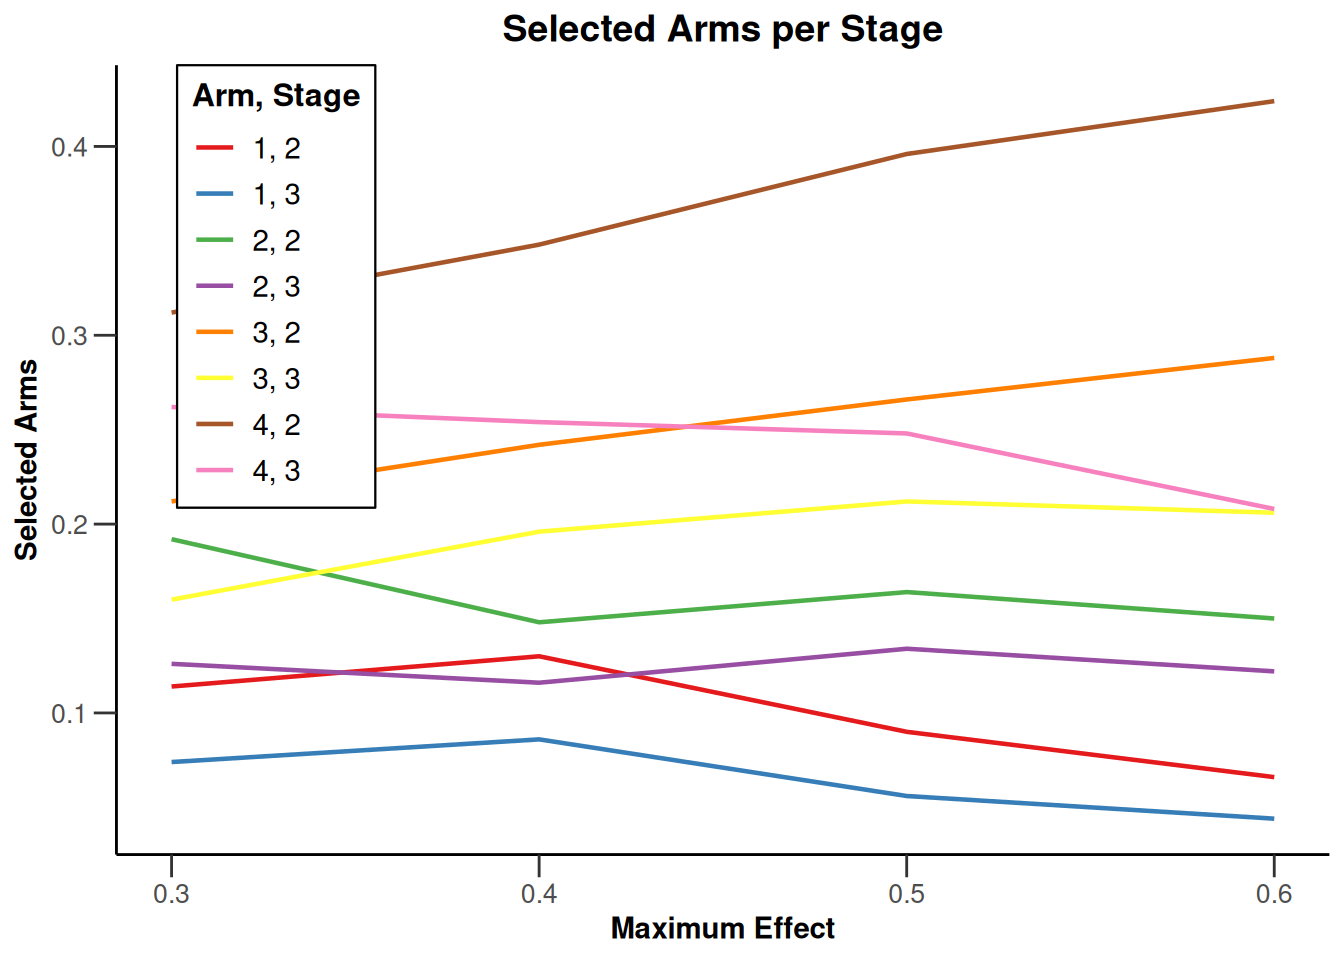
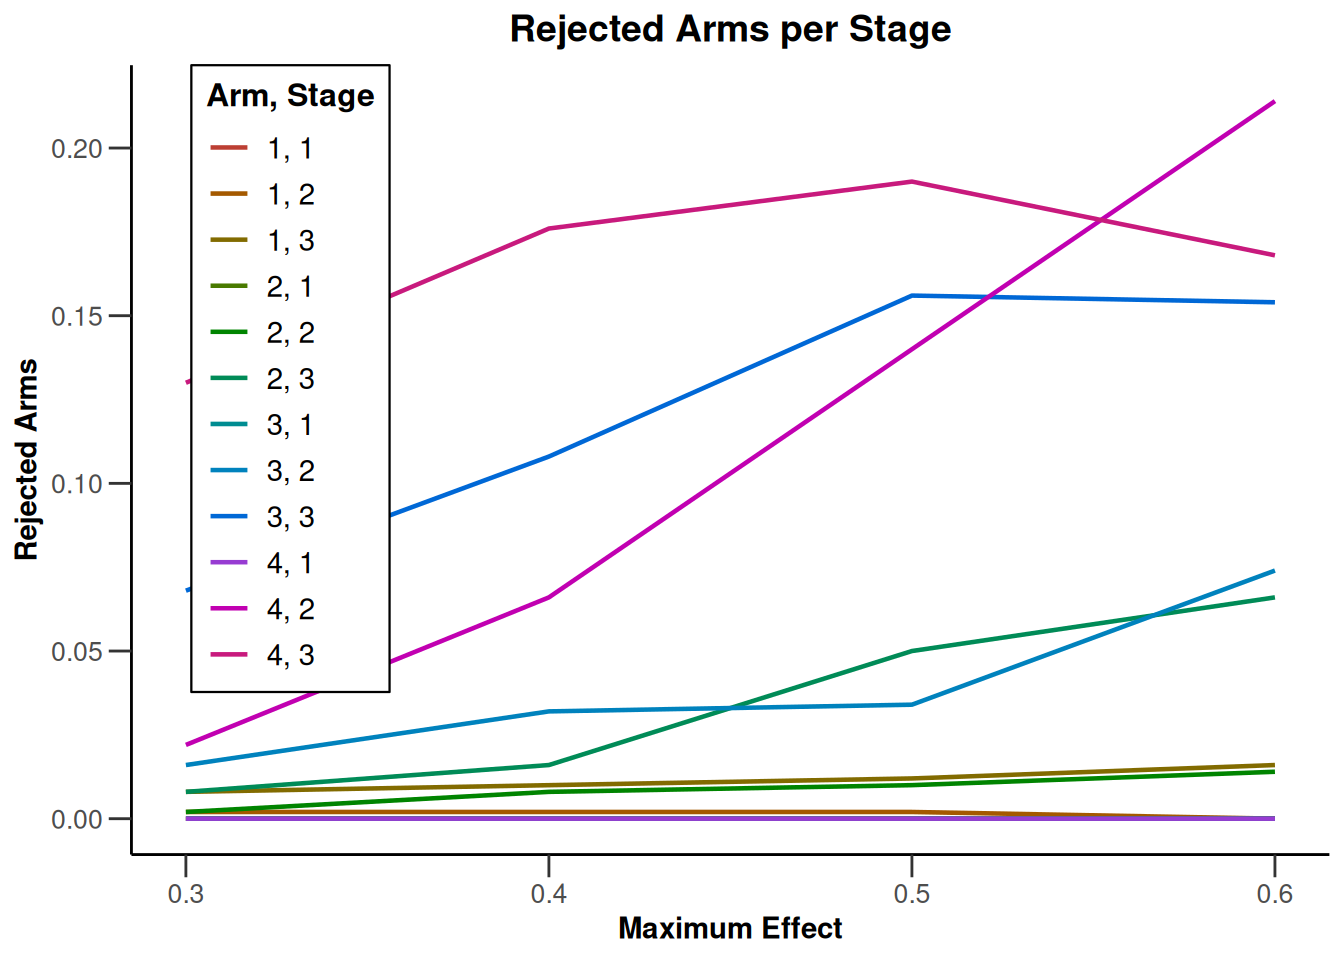
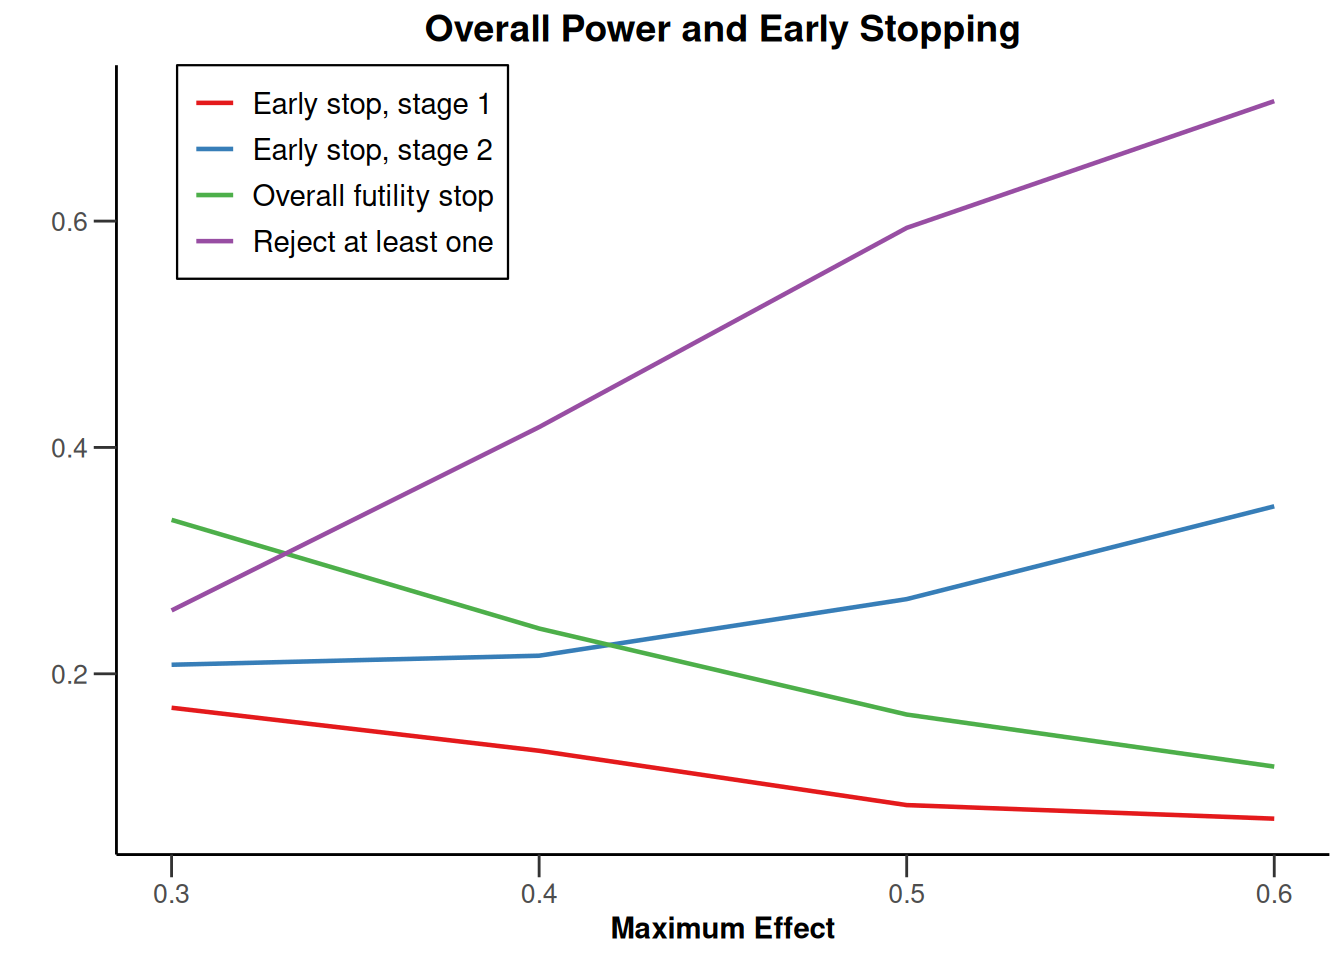
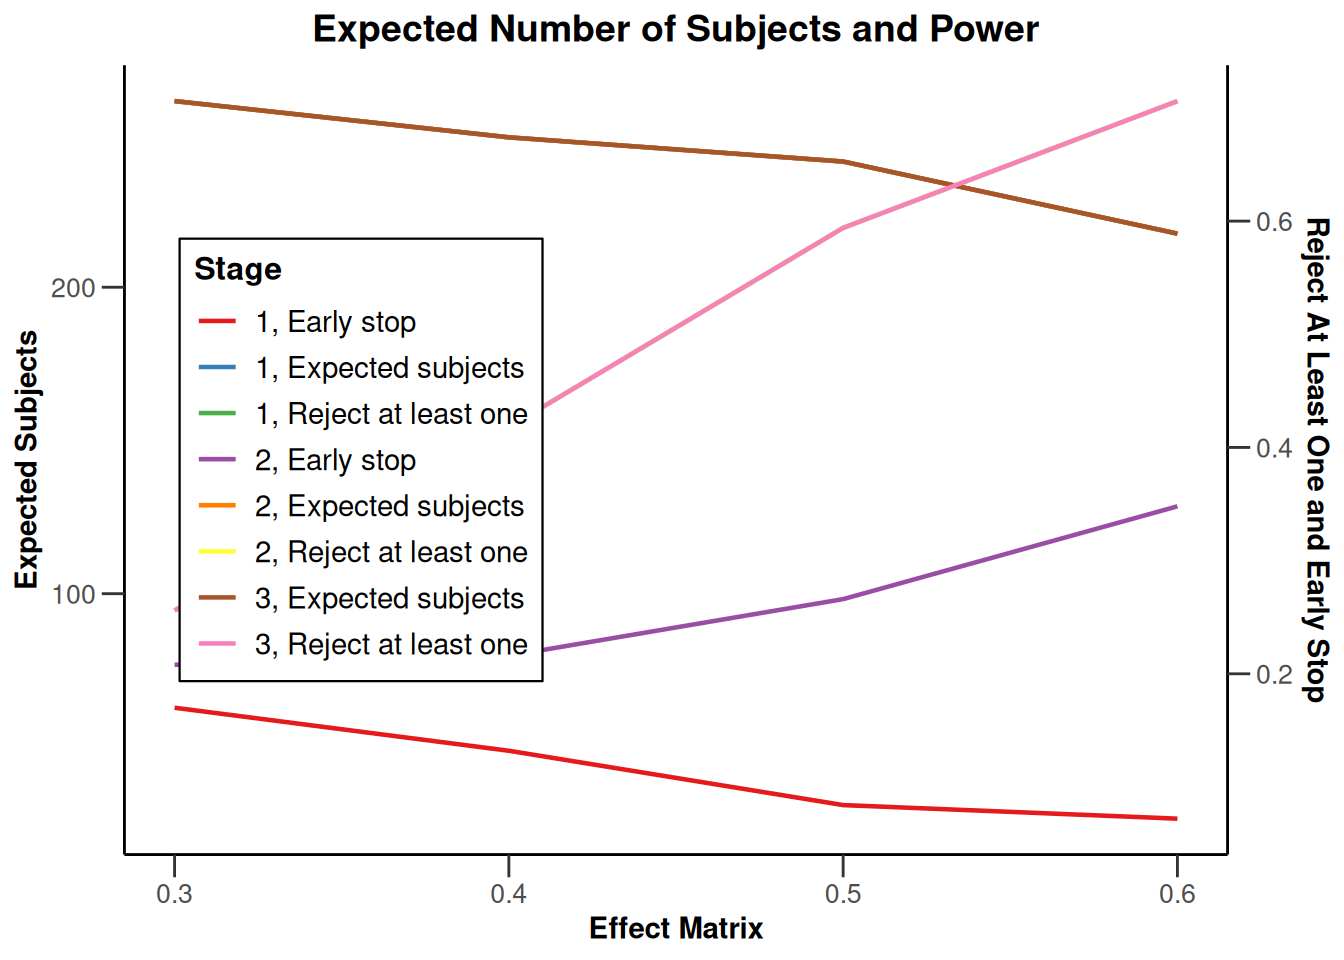
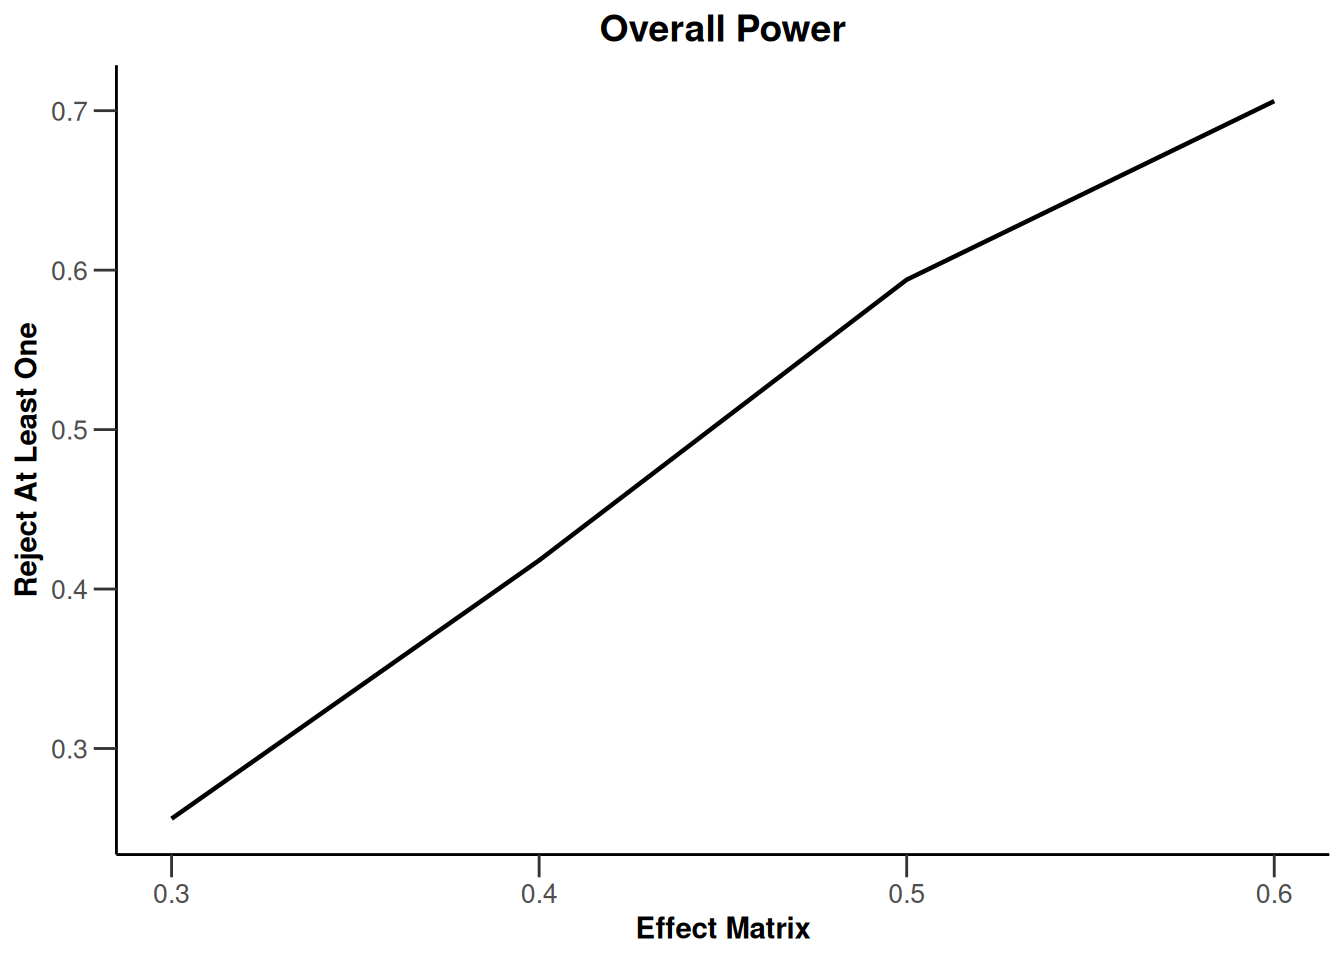
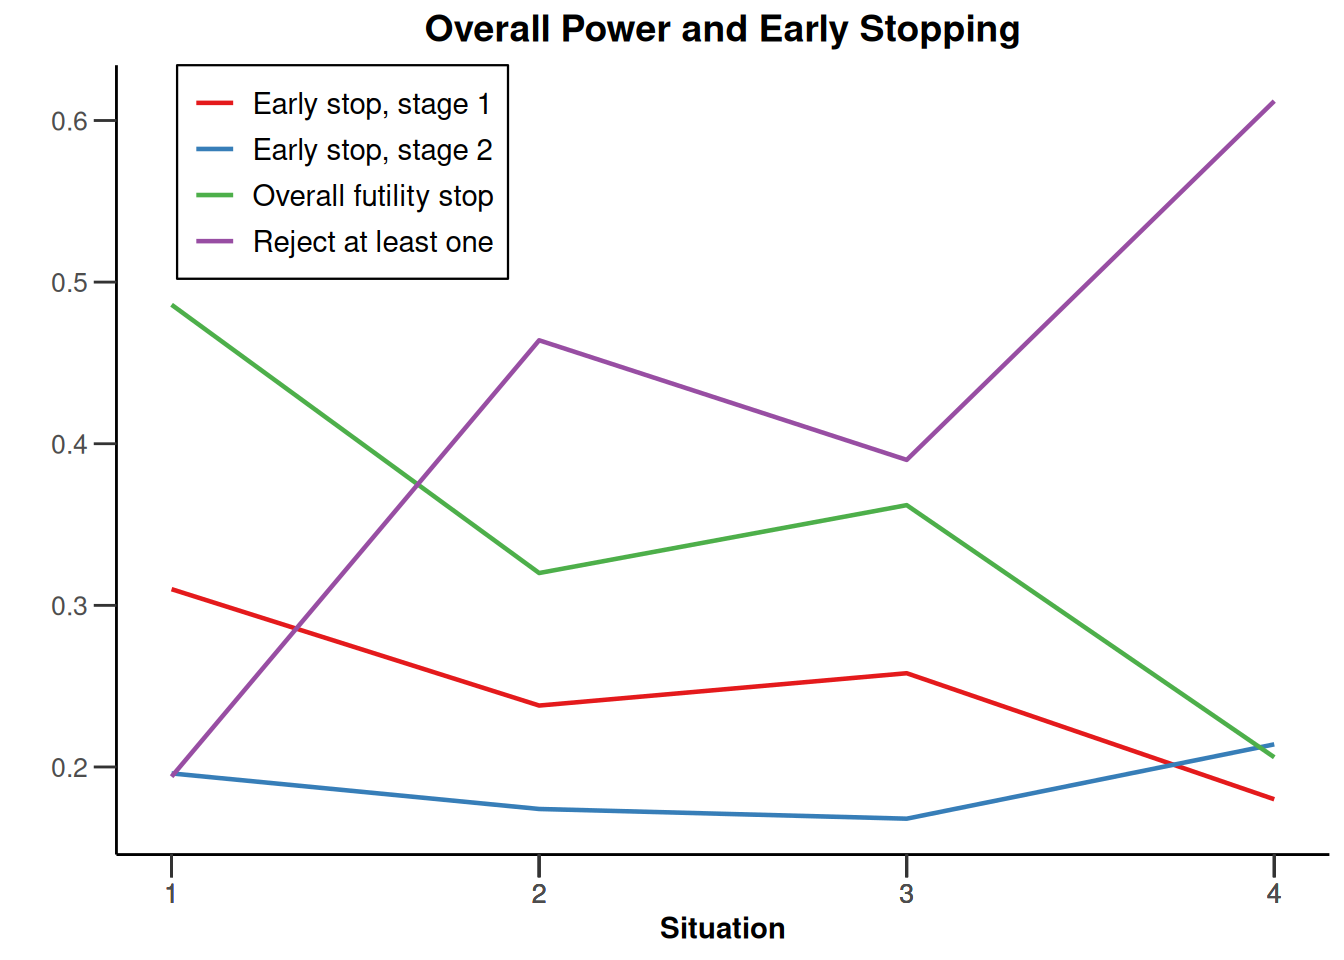
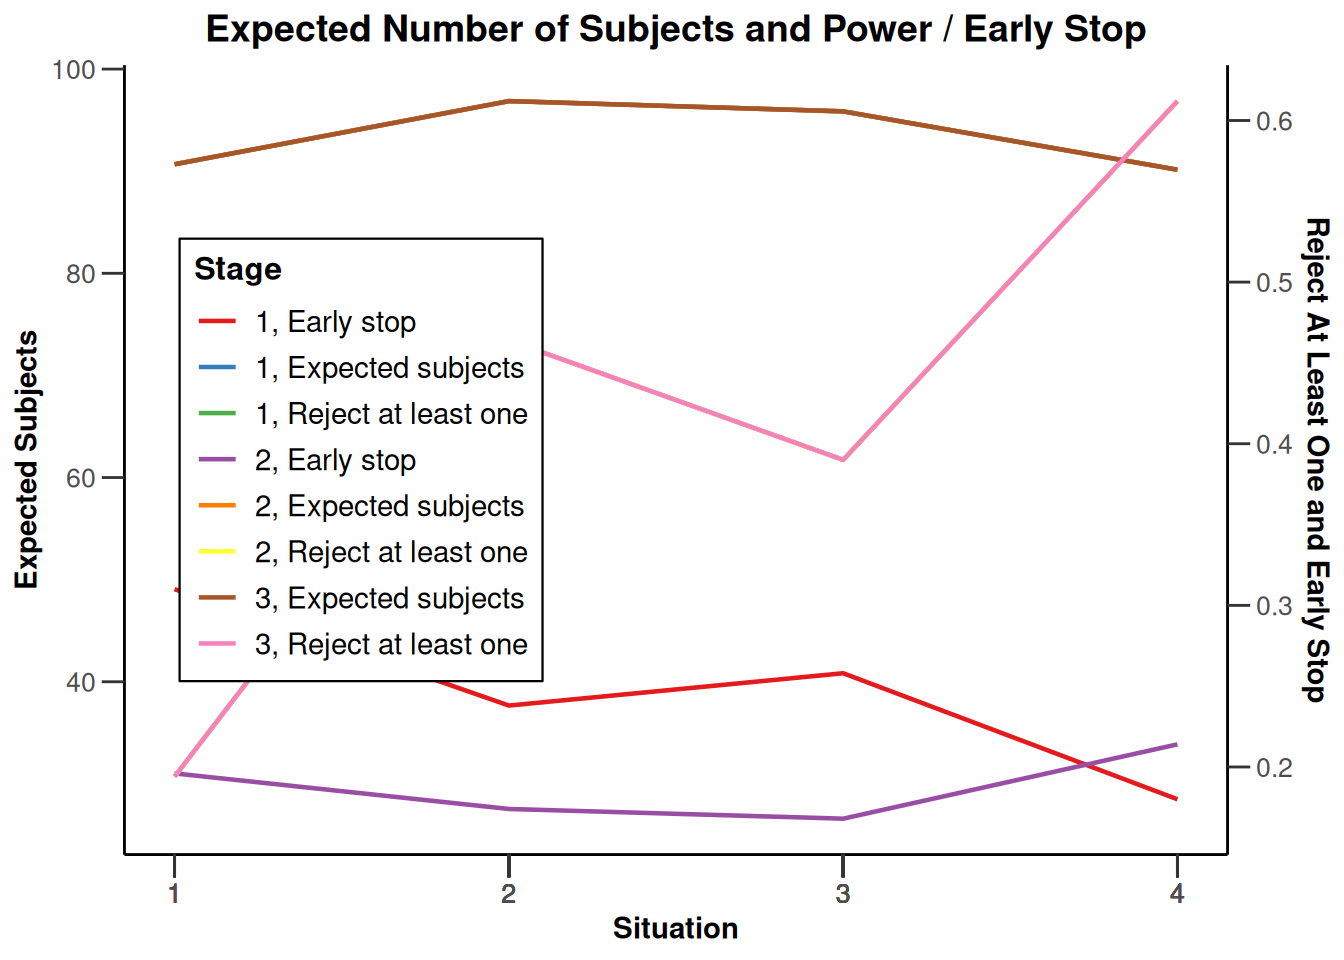
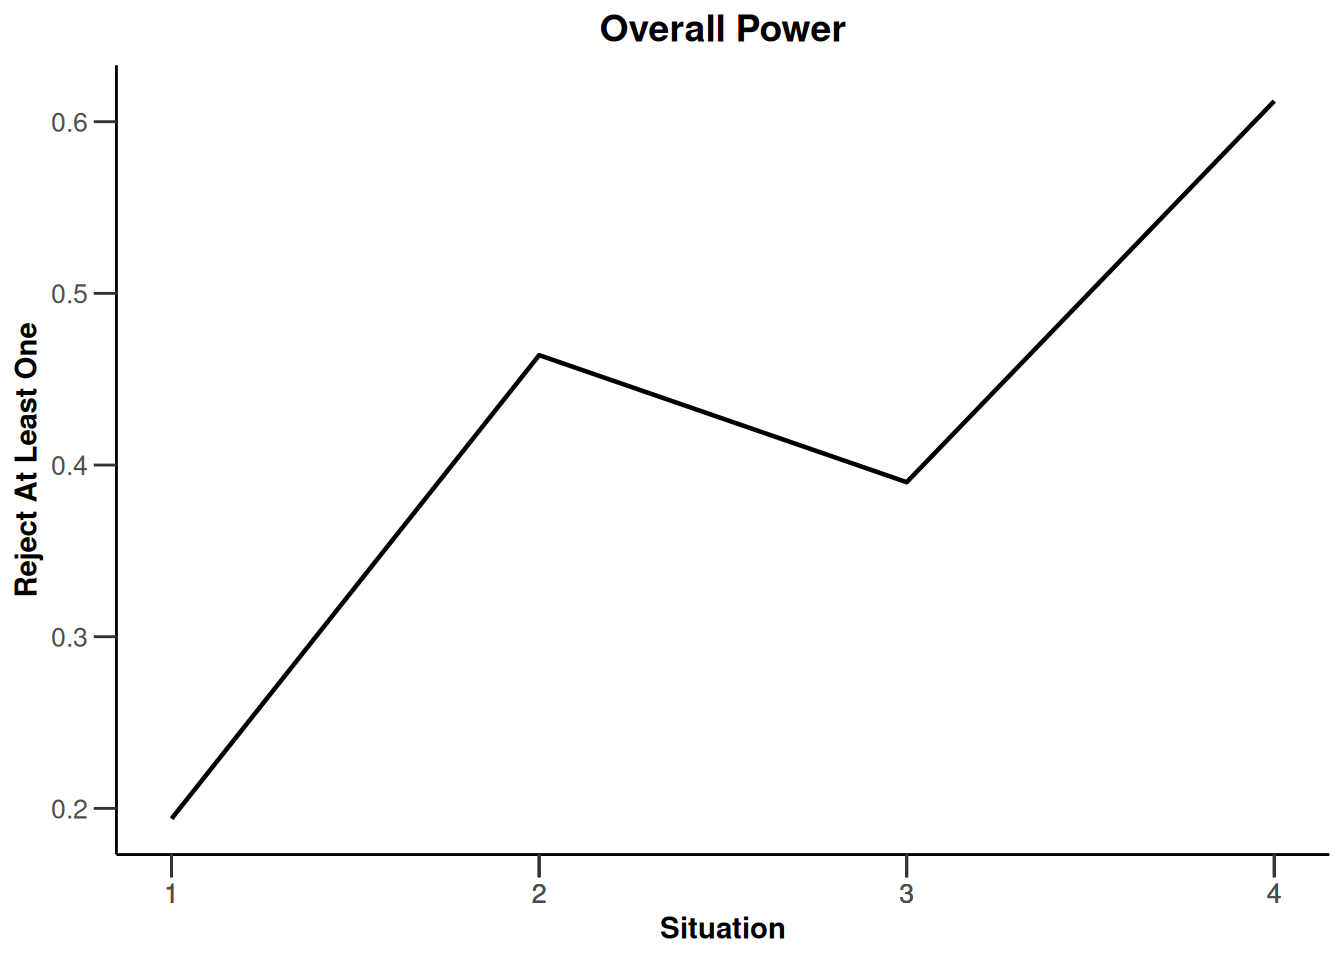
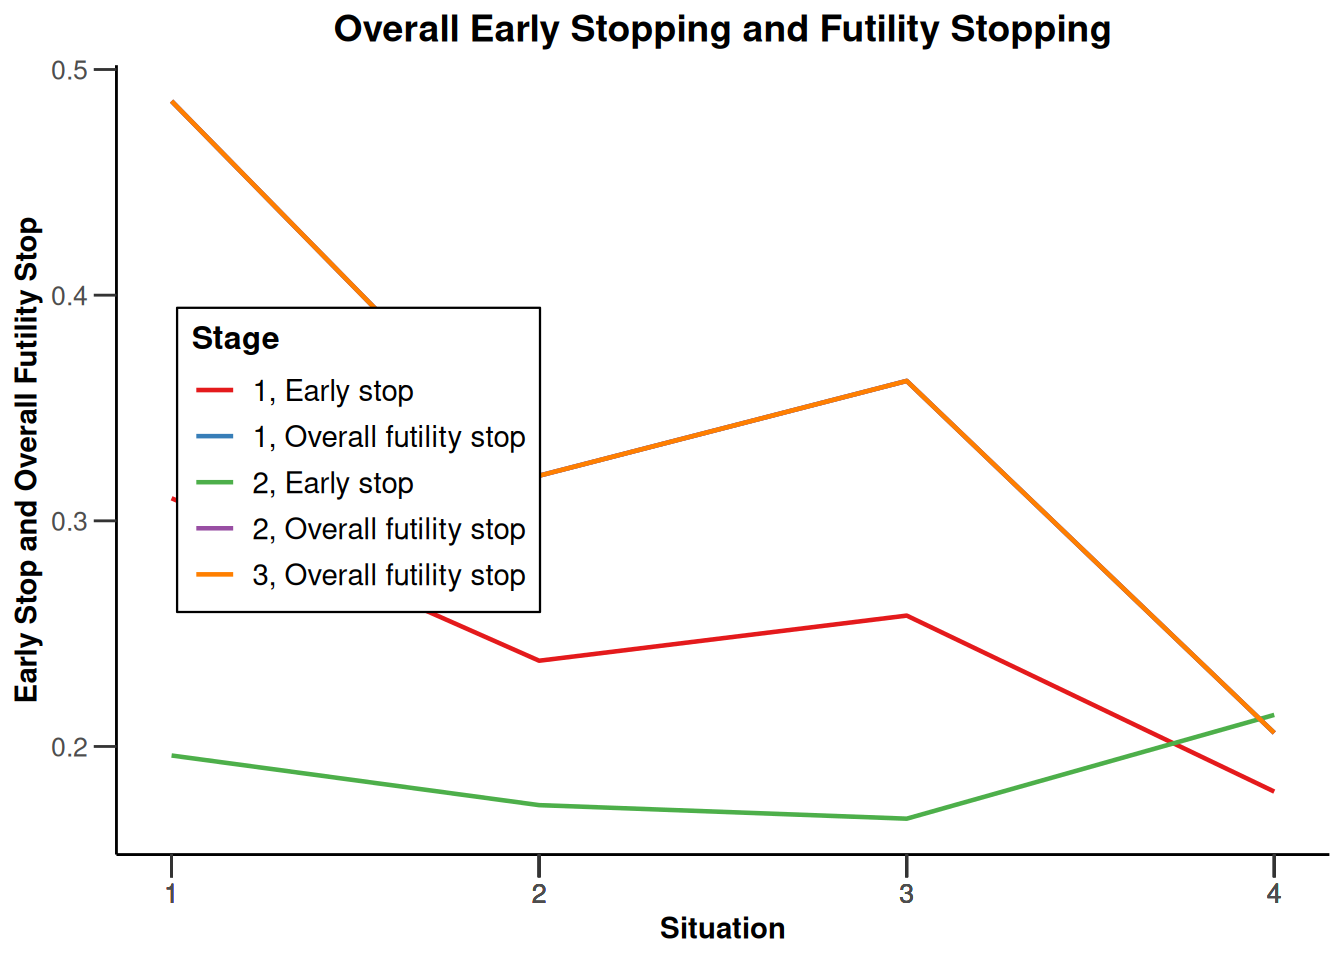
Simulation results multi-arm
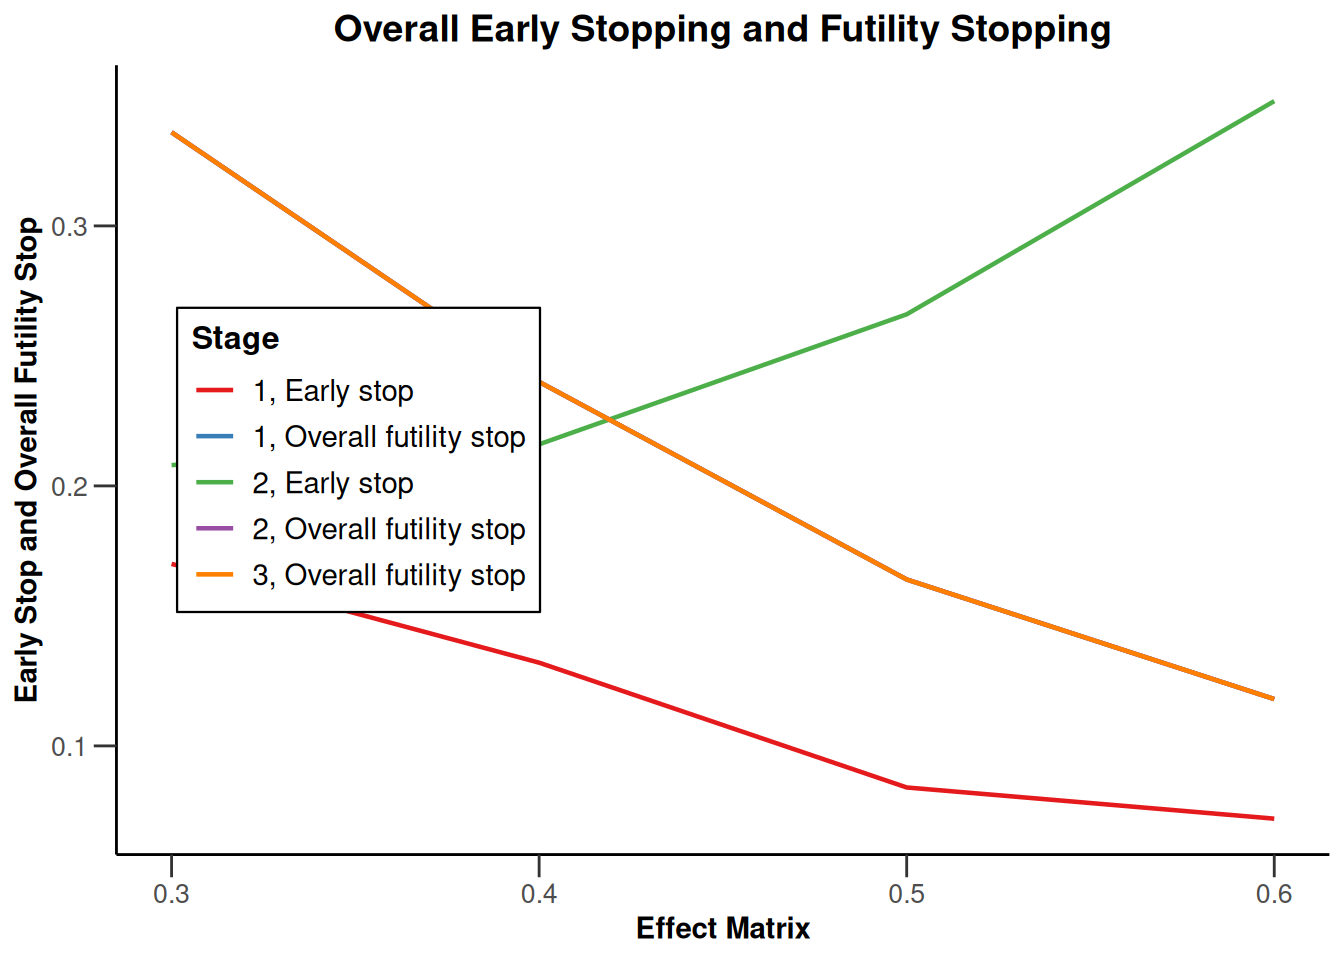
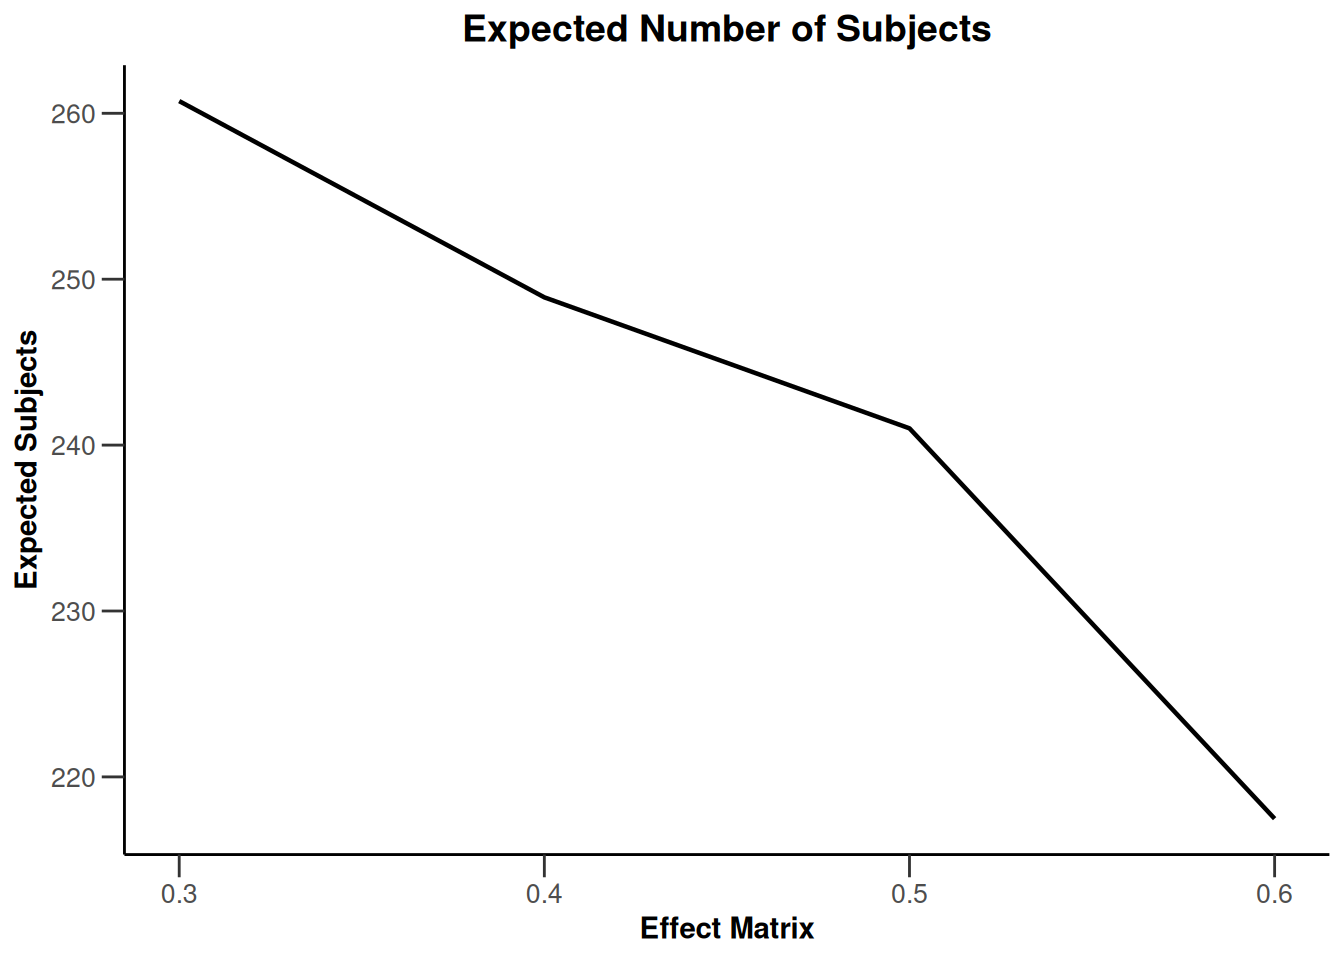
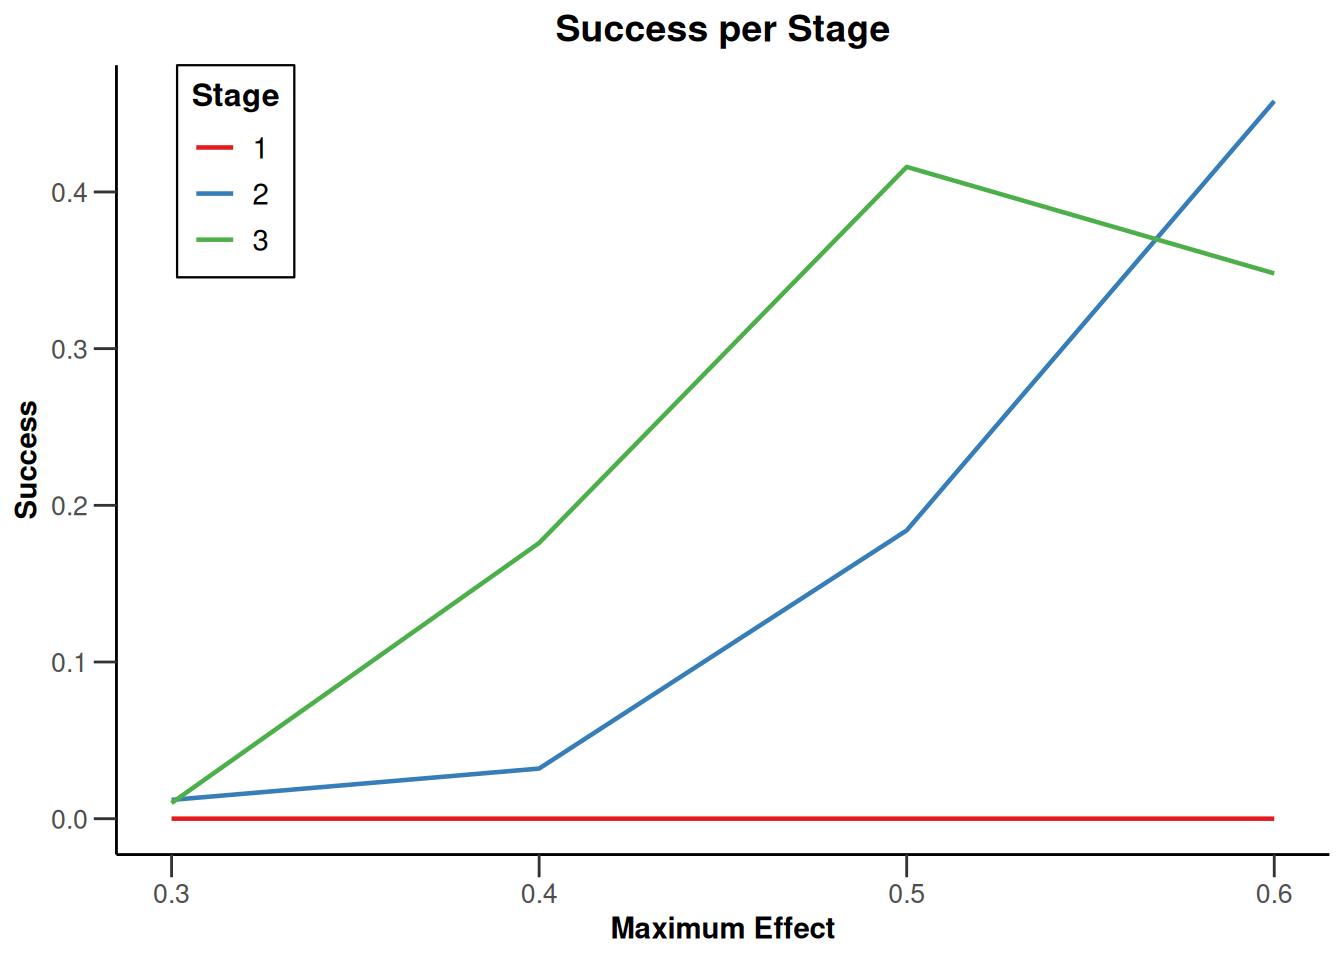
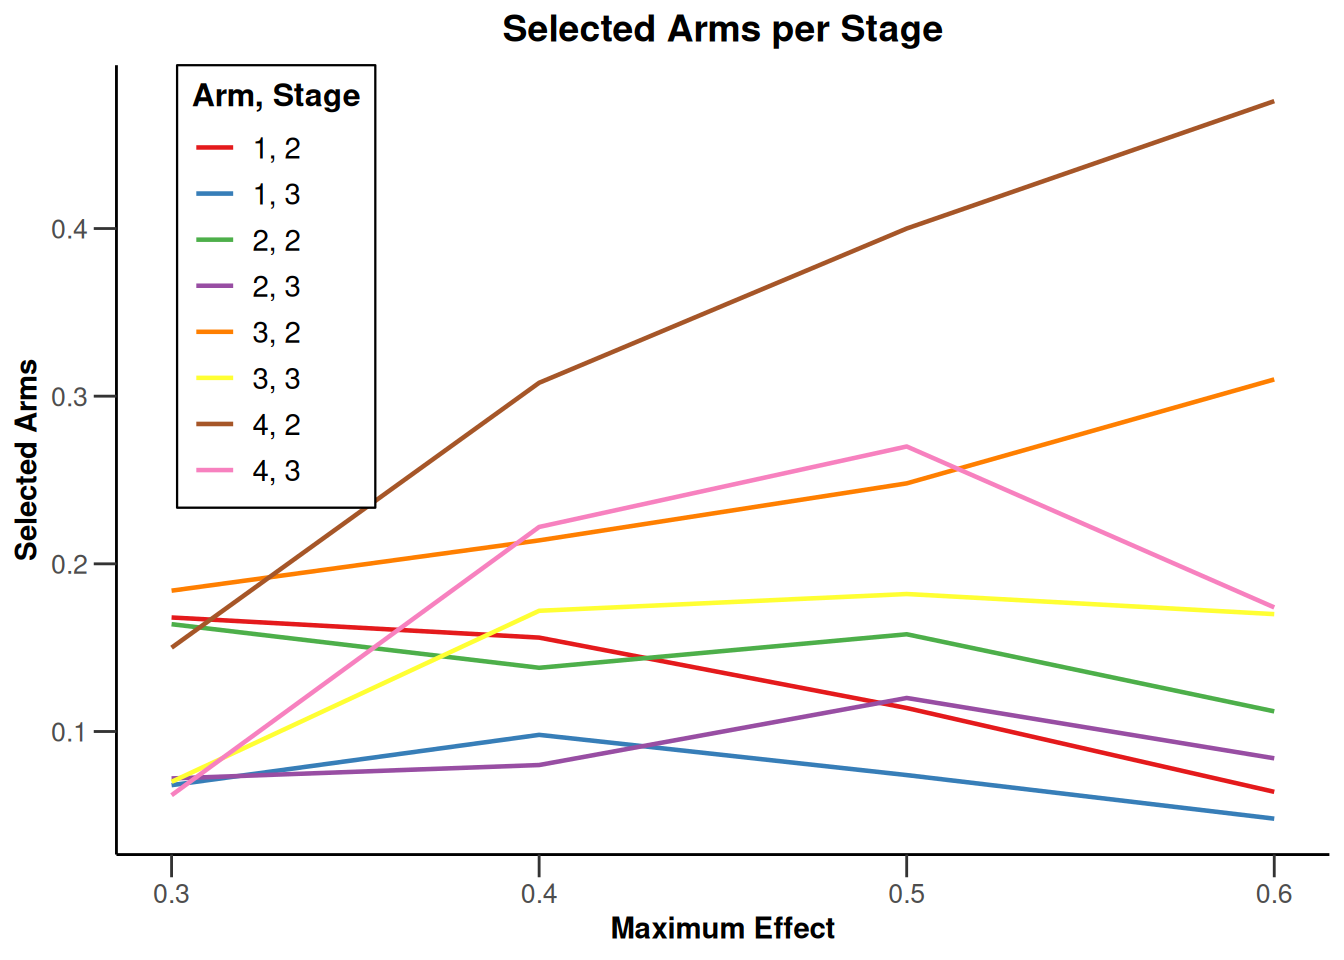
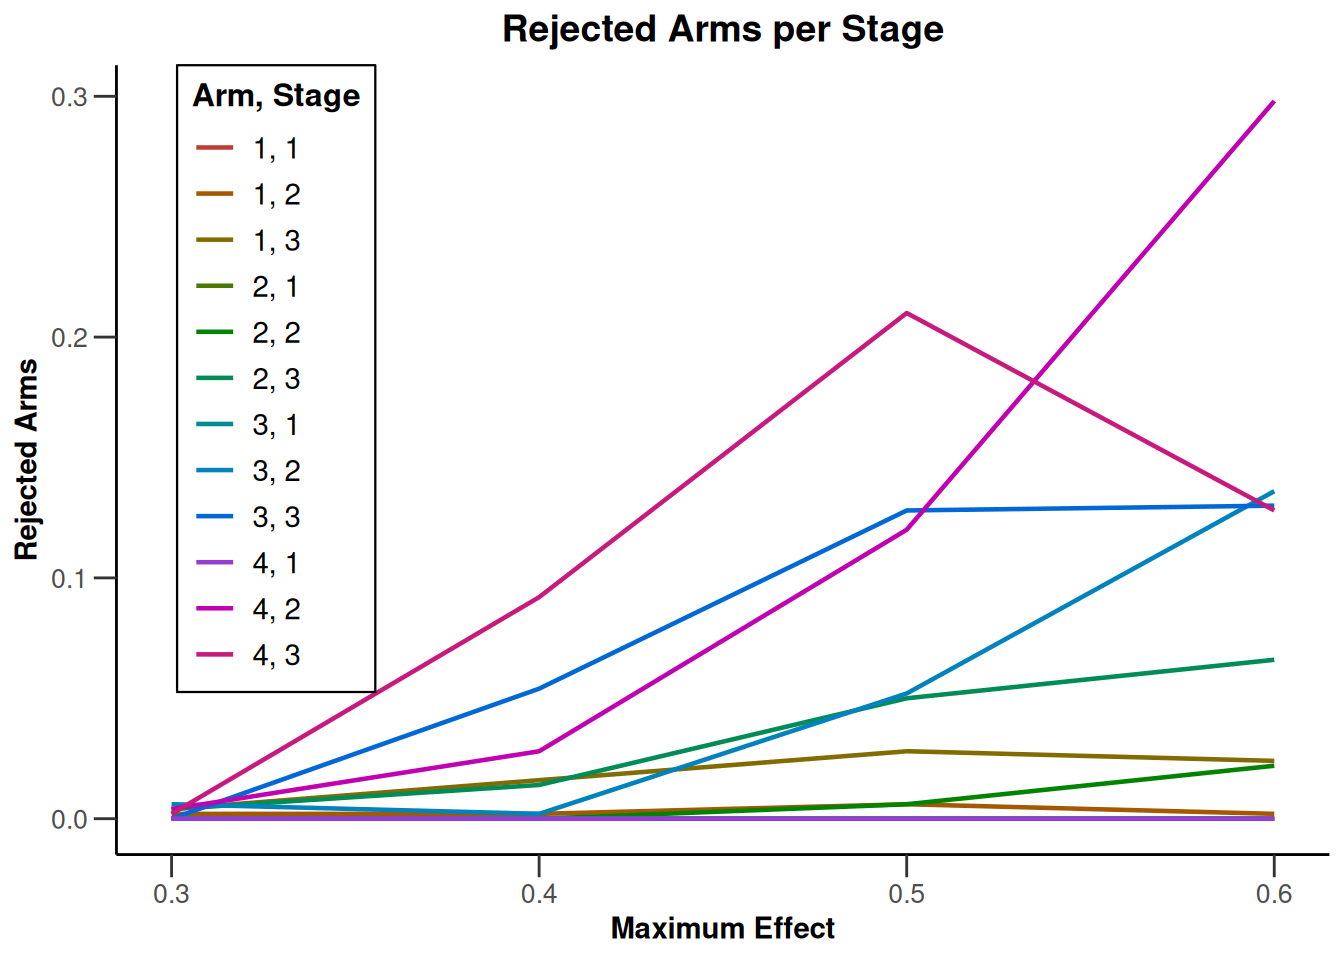
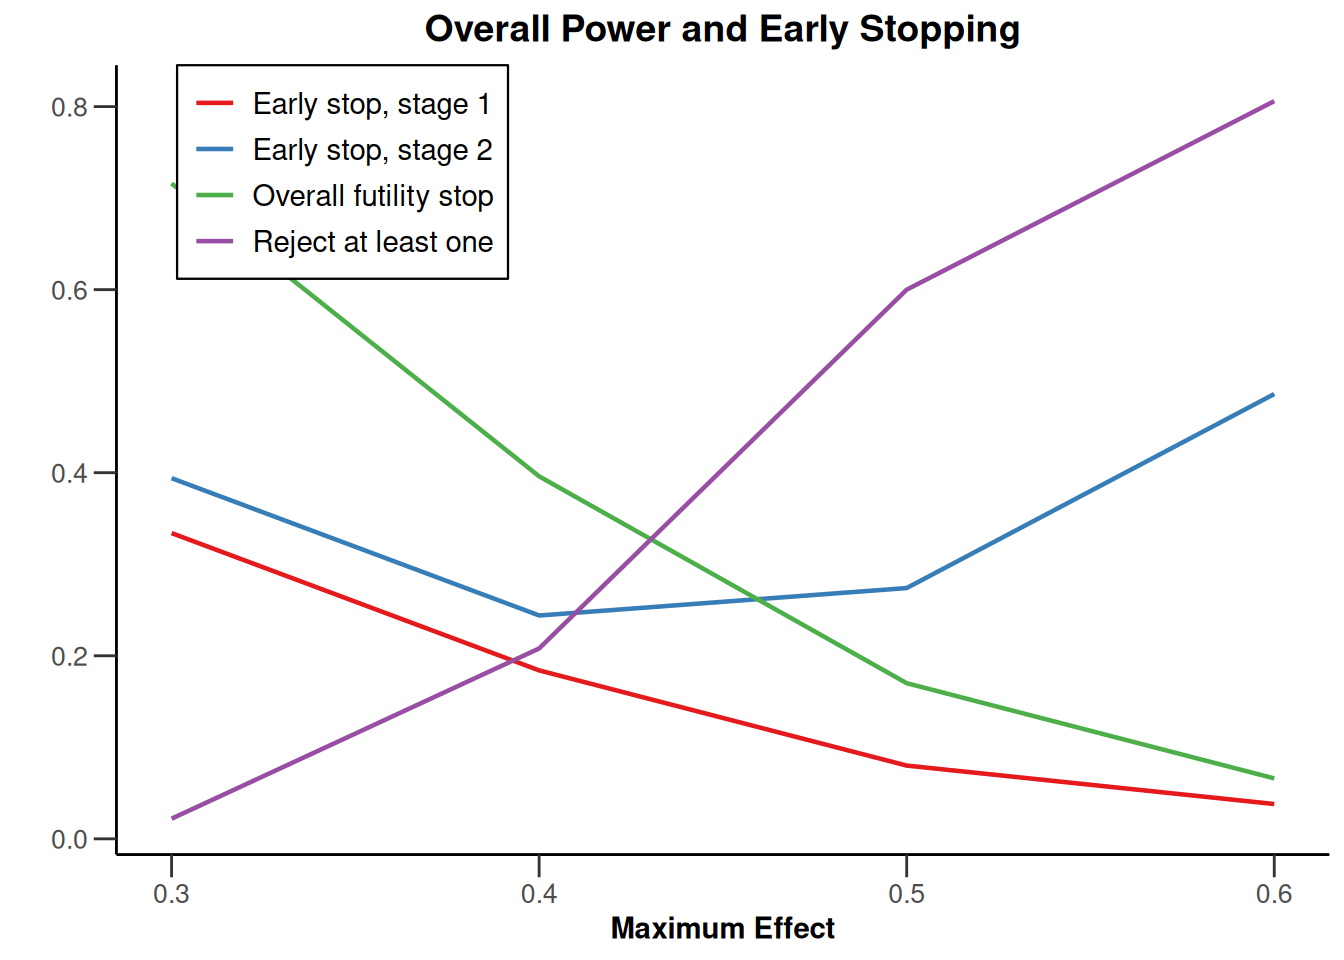
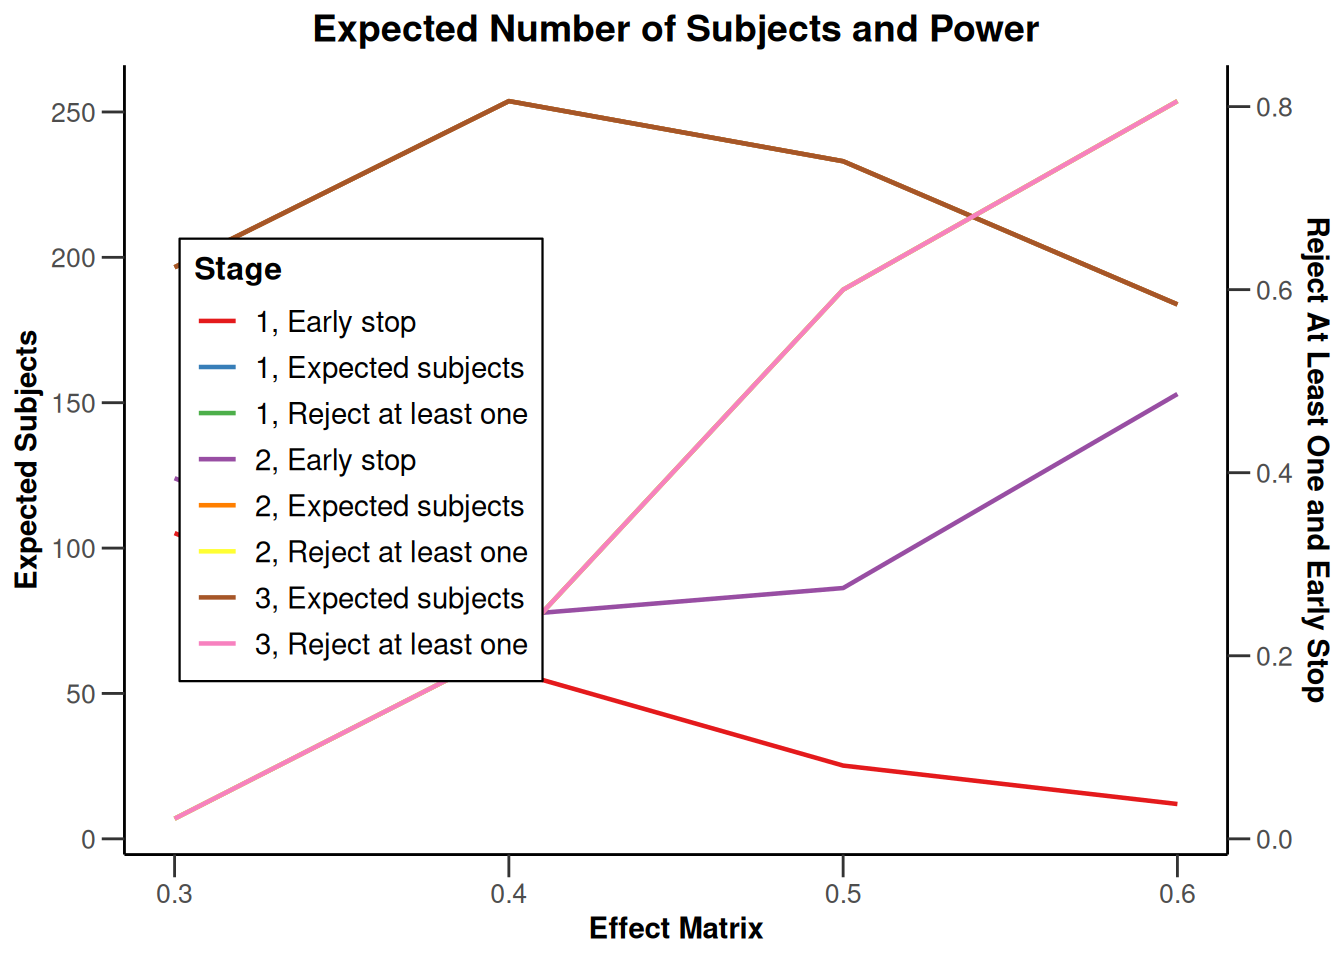
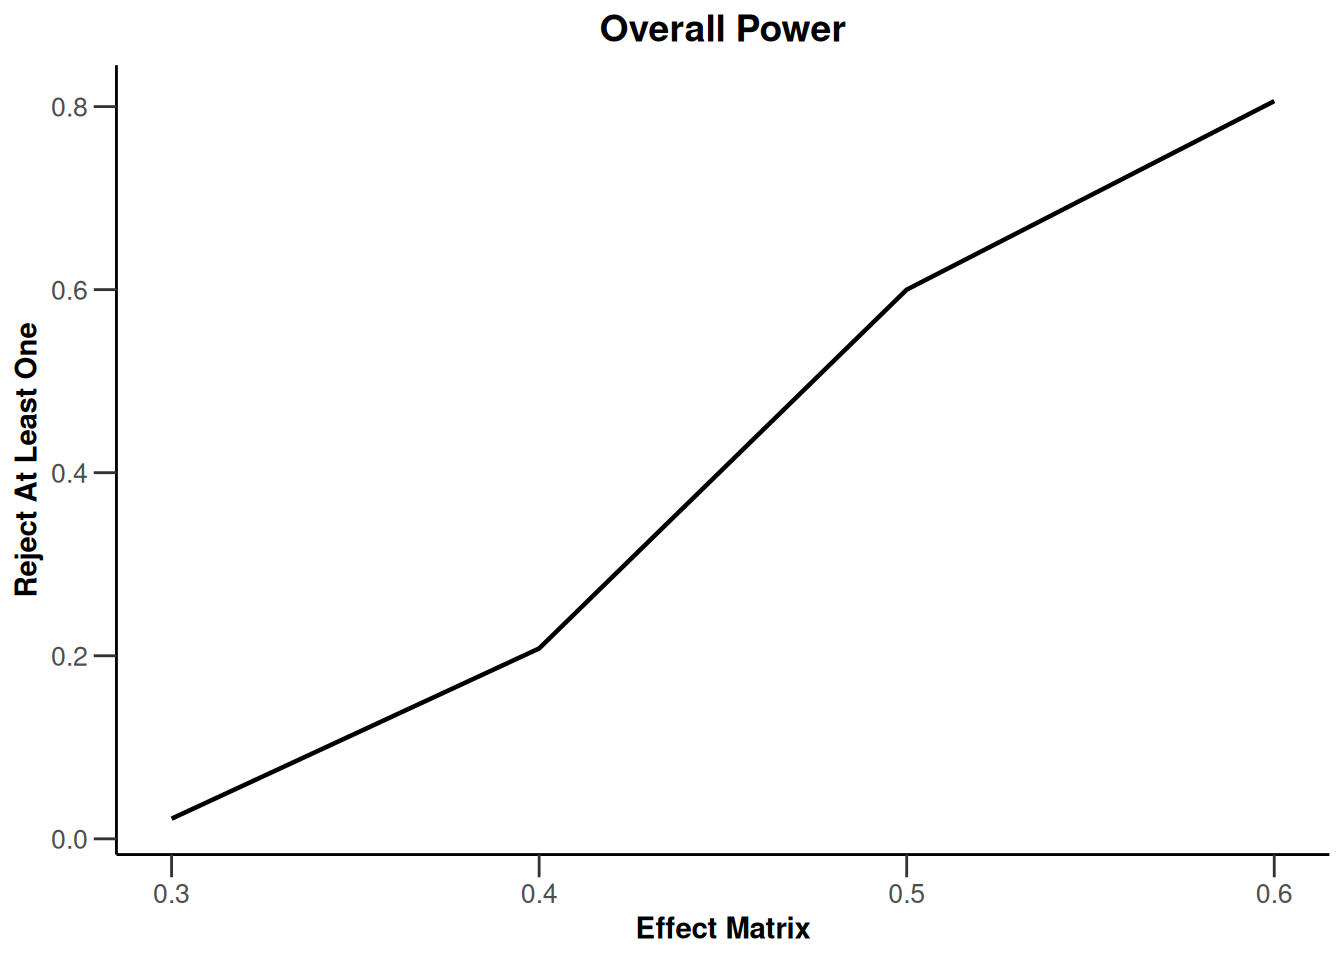
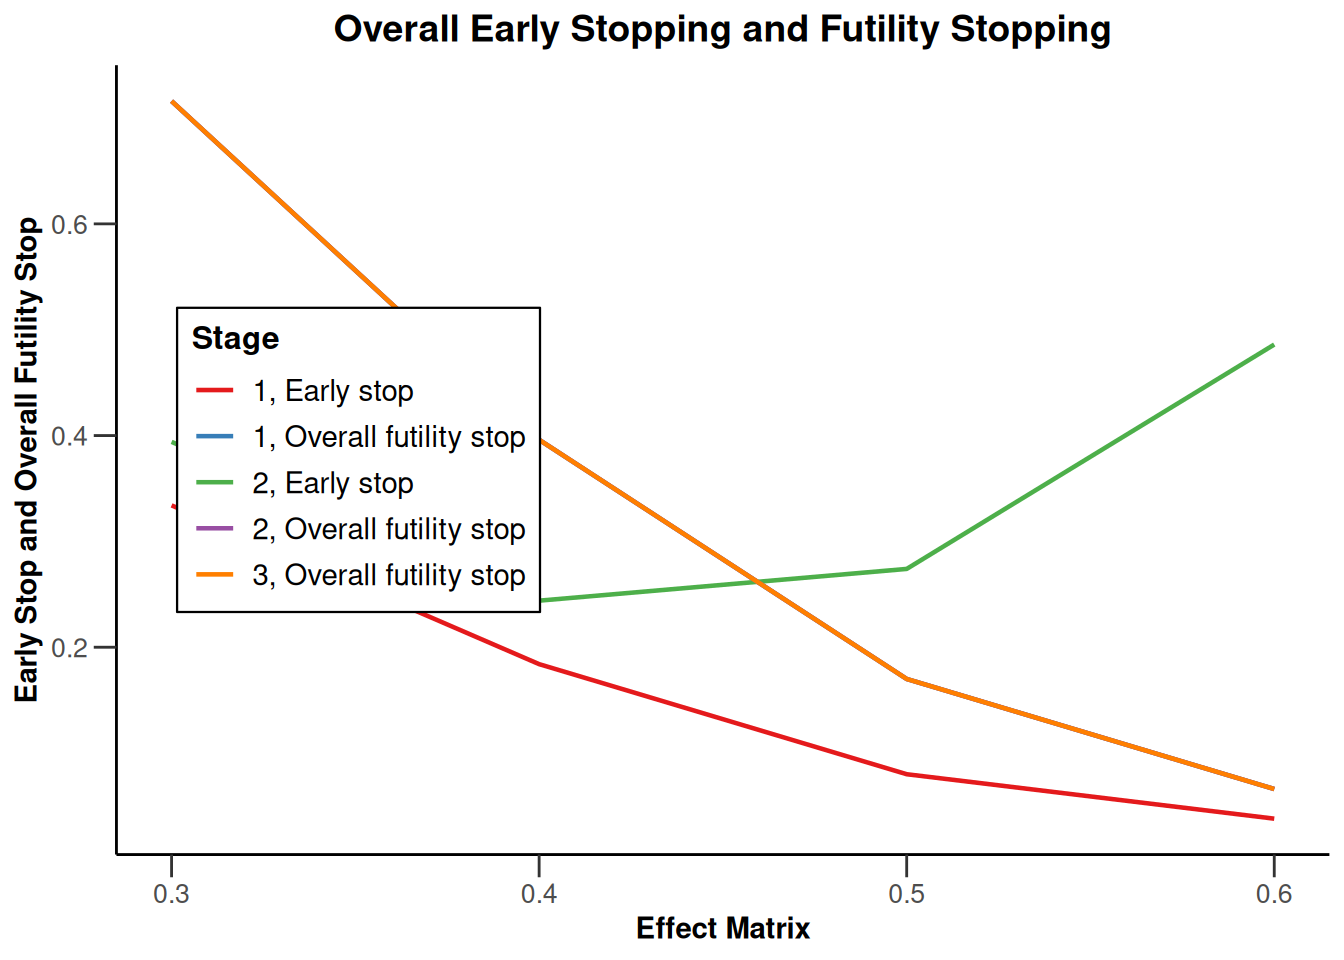
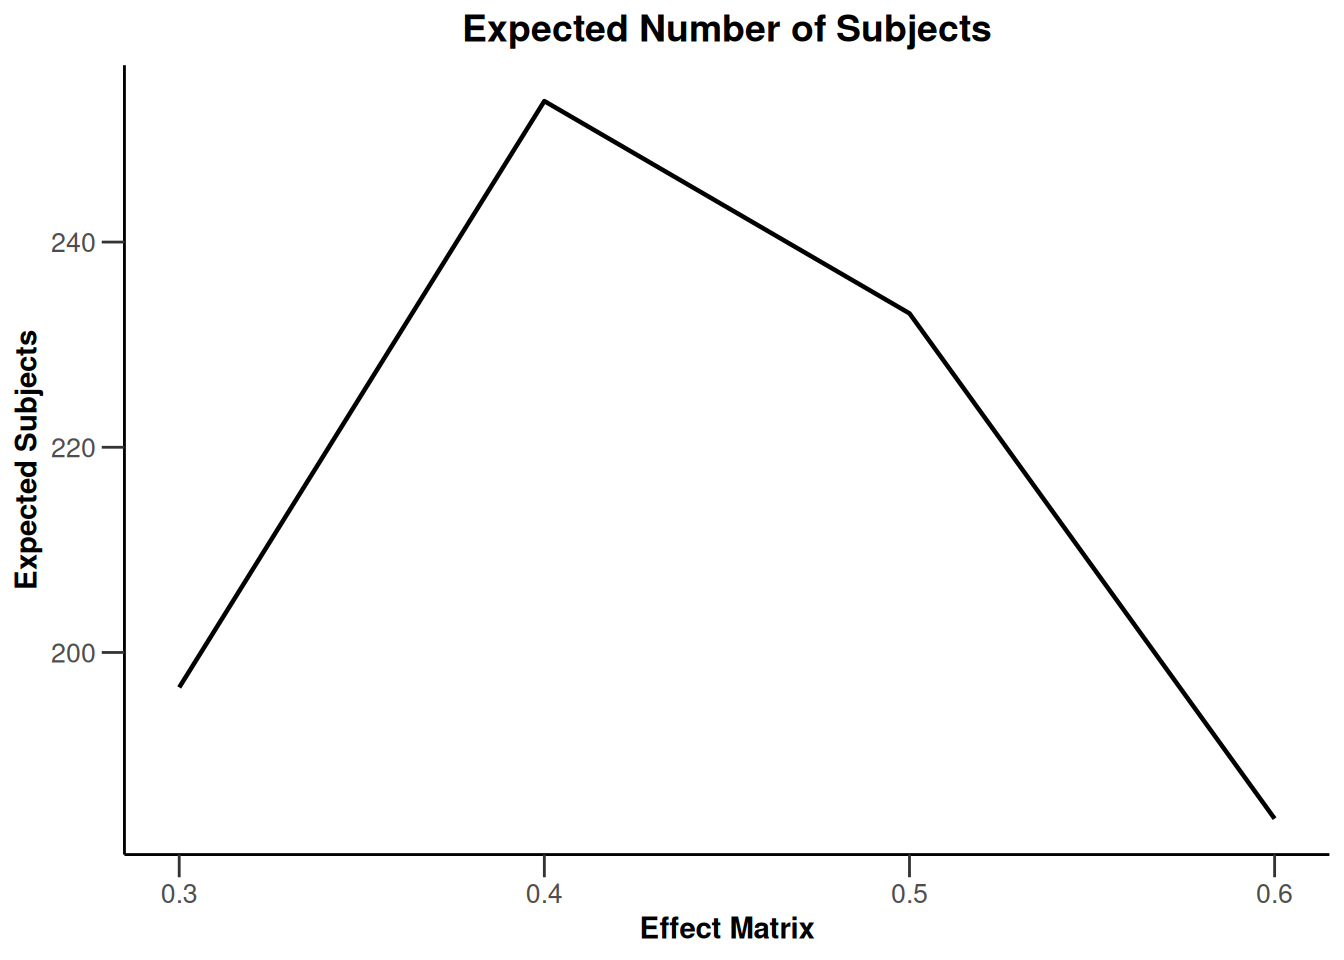
Simulation results multi-arm - means
getDesignInverseNormal(
    informationRates = c(0.2, 0.6, 1),
    futilityBounds = c(-0.5, 0.5)
) |>
  getSimulationMultiArmMeans(
    typeOfShape = "linear",
    activeArms = 4,
    plannedSubjects = c(10, 30, 50),
    stDev = 1.2,
    muMaxVector = seq(0.3, 0.6, 0.1),
    adaptations = rep(TRUE, 2),
    conditionalPower = 0.8,
    minNumberOfSubjectsPerStage = c(10, 4, 4),
    maxNumberOfSubjectsPerStage = c(10, 100, 100),
    maxNumberOfIterations = 500,
    seed = 1234567890
) |>
  plot(type = "all", grid = 0)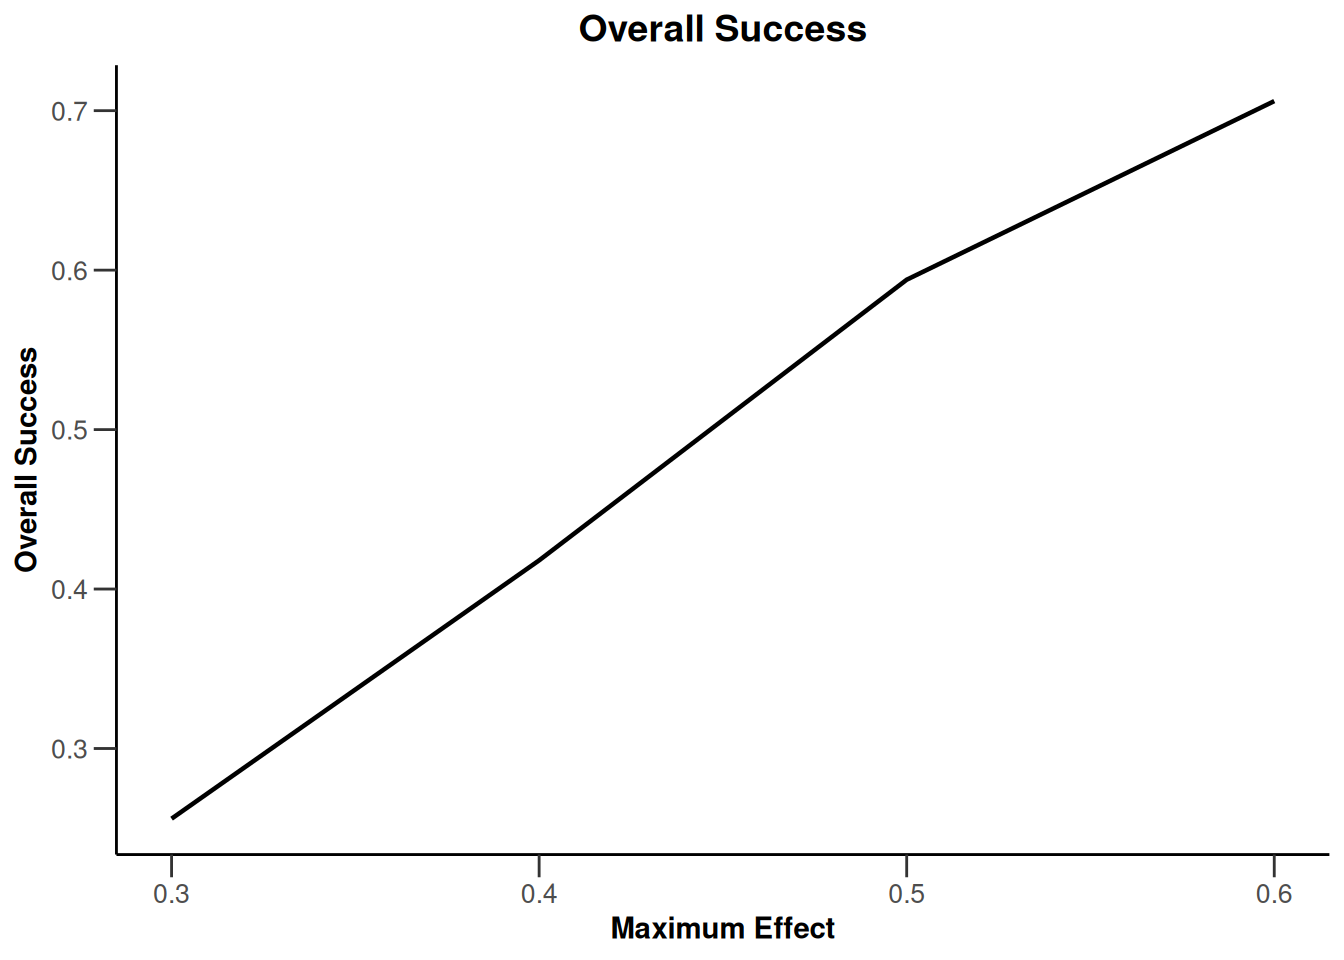
Simulation results multi-arm - rates
getDesignInverseNormal(
    informationRates = c(0.2, 0.6, 1),
    futilityBounds = c(-0.5, 0.5)
) |>
  getSimulationMultiArmRates(
    typeOfShape = "linear",
    activeArms = 4,
    plannedSubjects = c(10, 30, 50),
    piControl = 0.3,
    piMaxVector = seq(0.3, 0.6, 0.1),
    adaptations = rep(TRUE, 2),
    conditionalPower = 0.8,
    minNumberOfSubjectsPerStage = c(10, 4, 4),
    maxNumberOfSubjectsPerStage = c(10, 100, 100),
    maxNumberOfIterations = 500,
    seed = 1234567890
) |>
  plot(type = "all", grid = 0)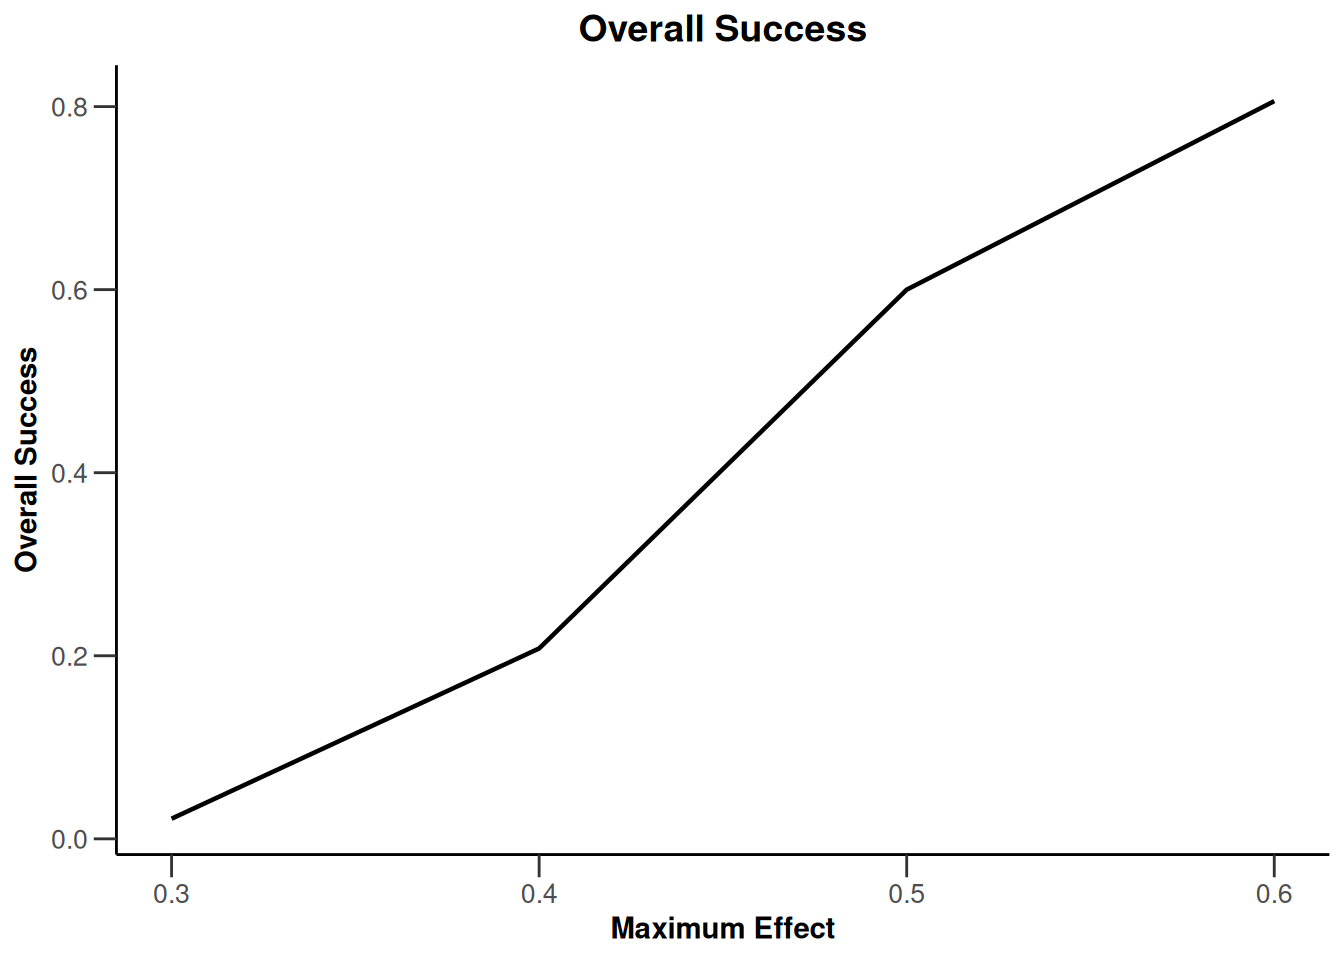
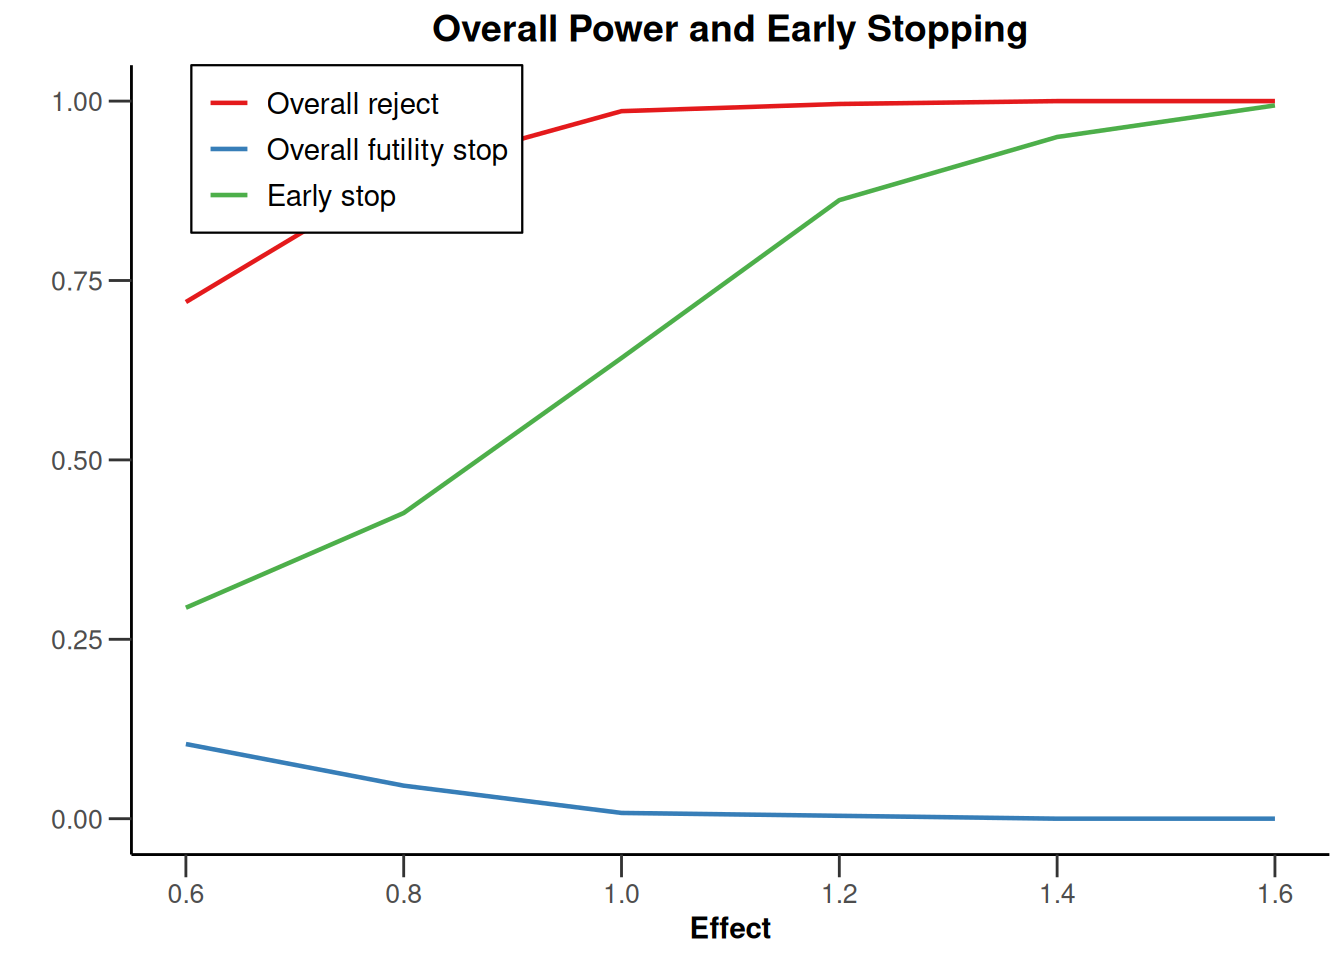
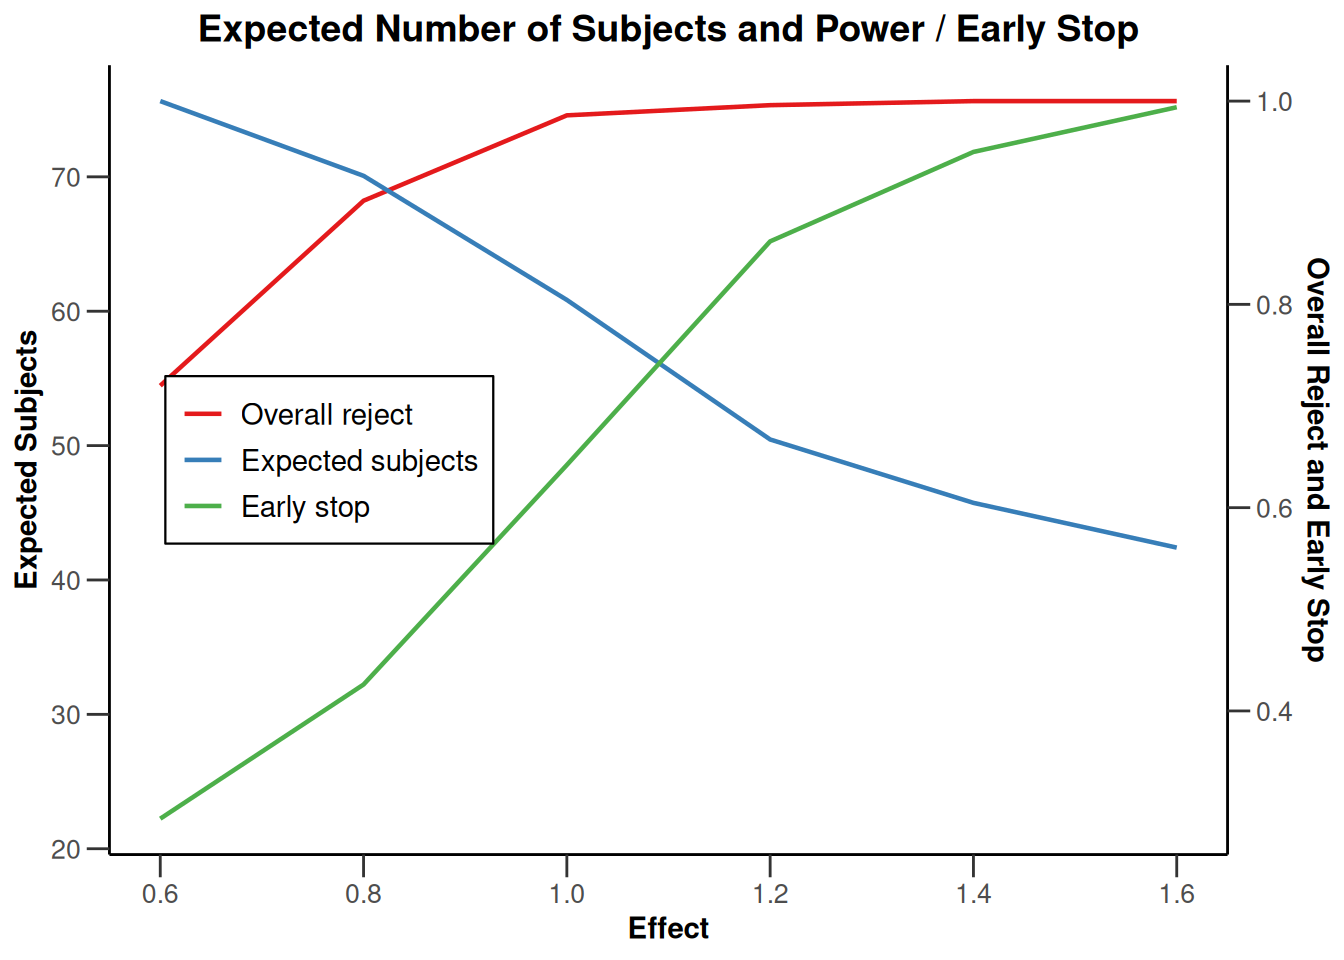
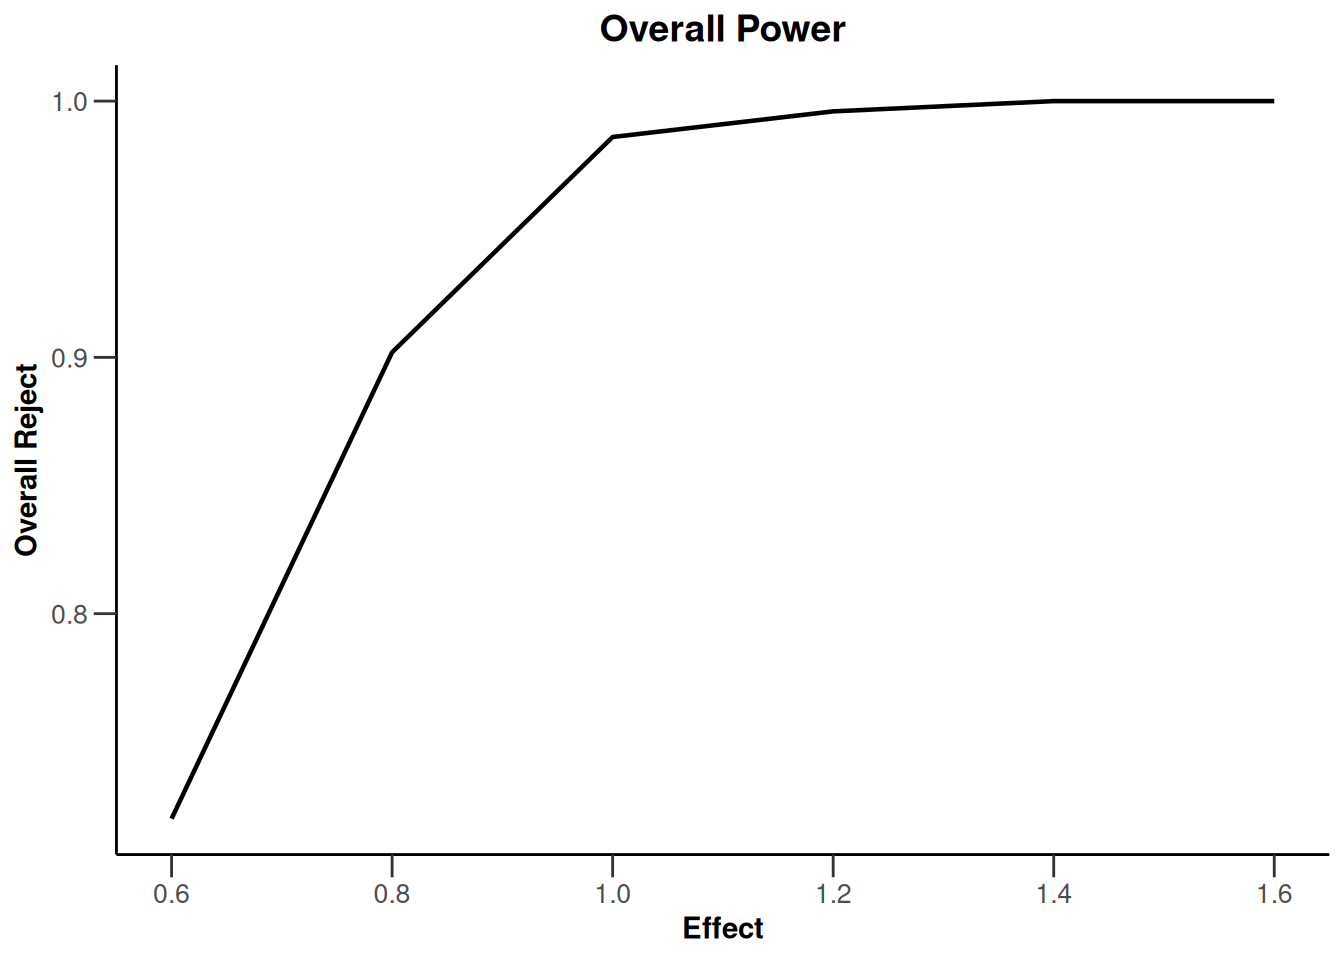
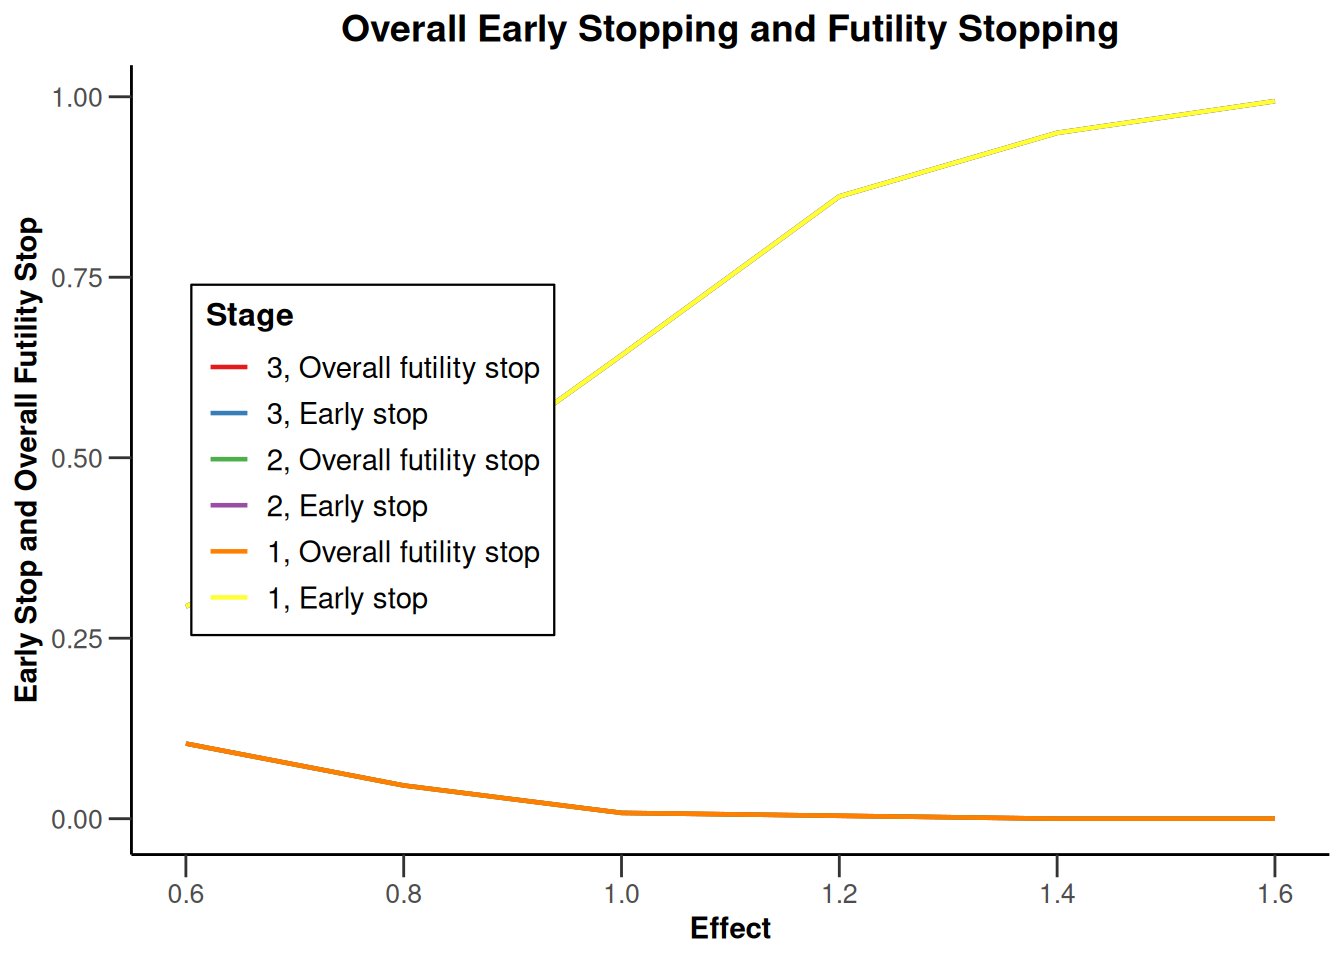
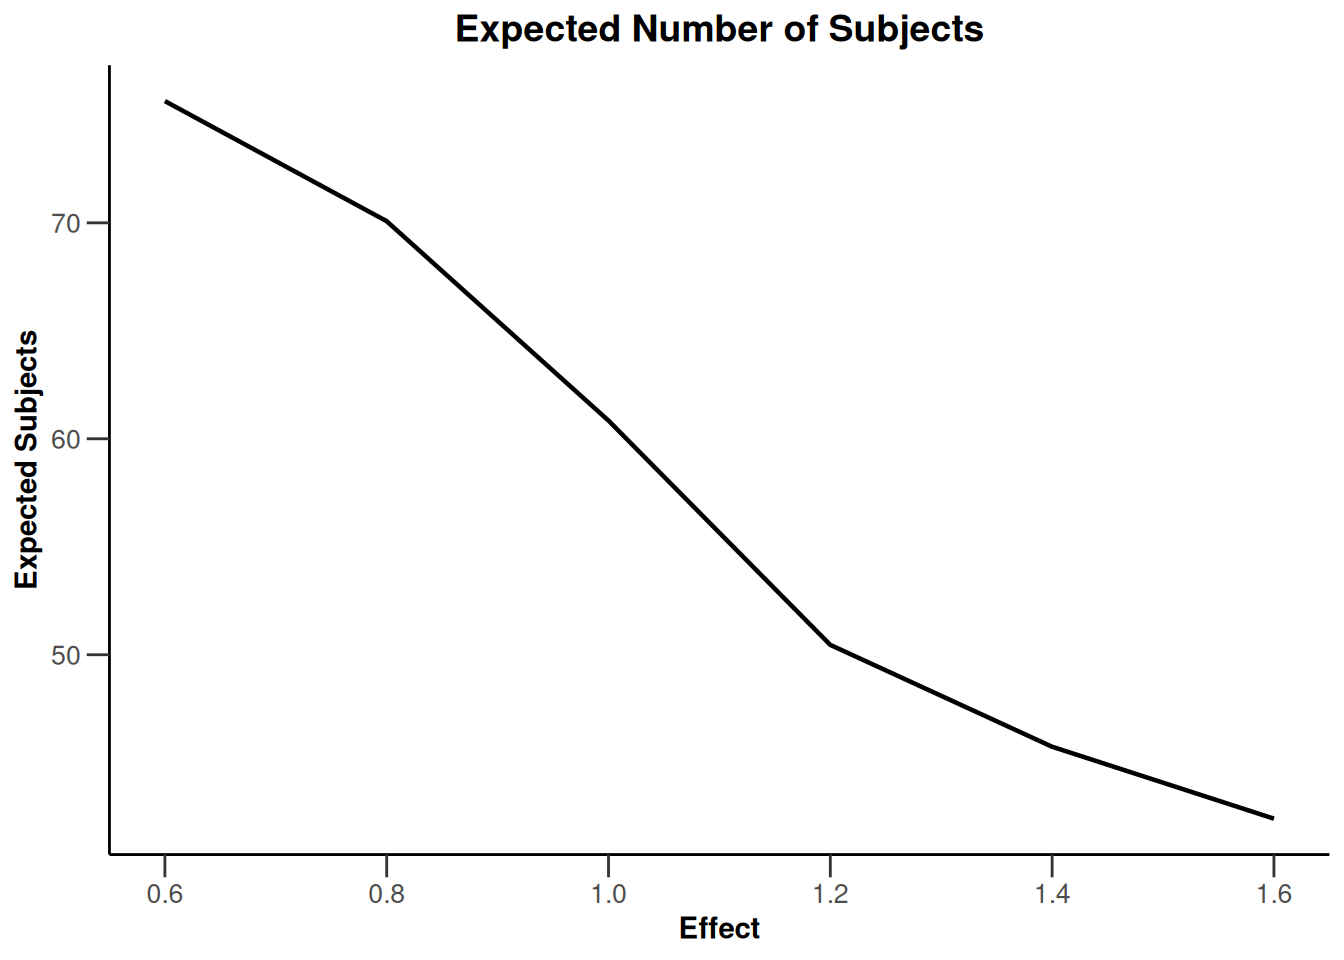
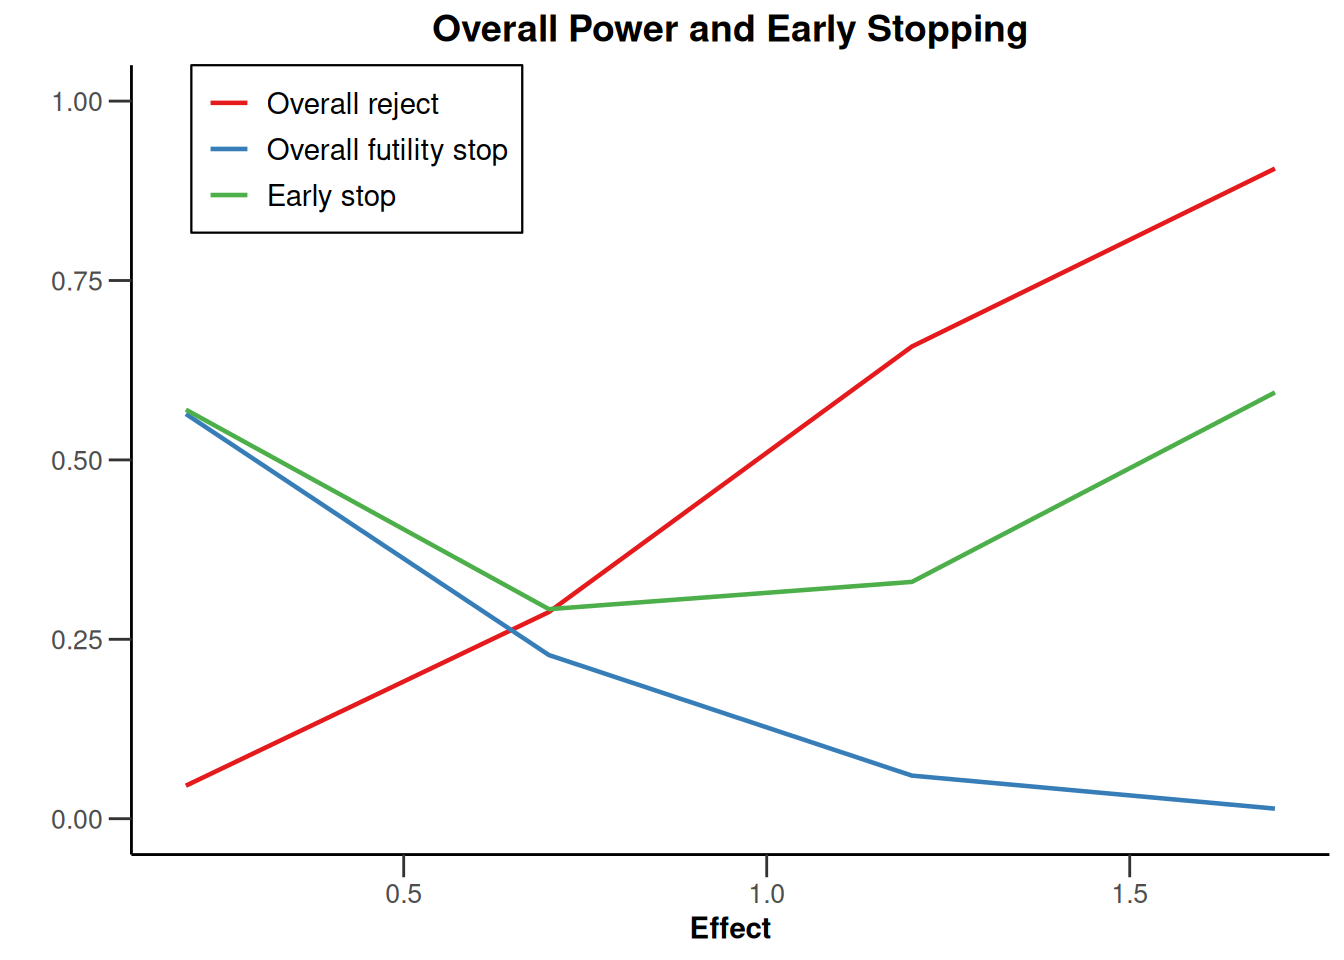
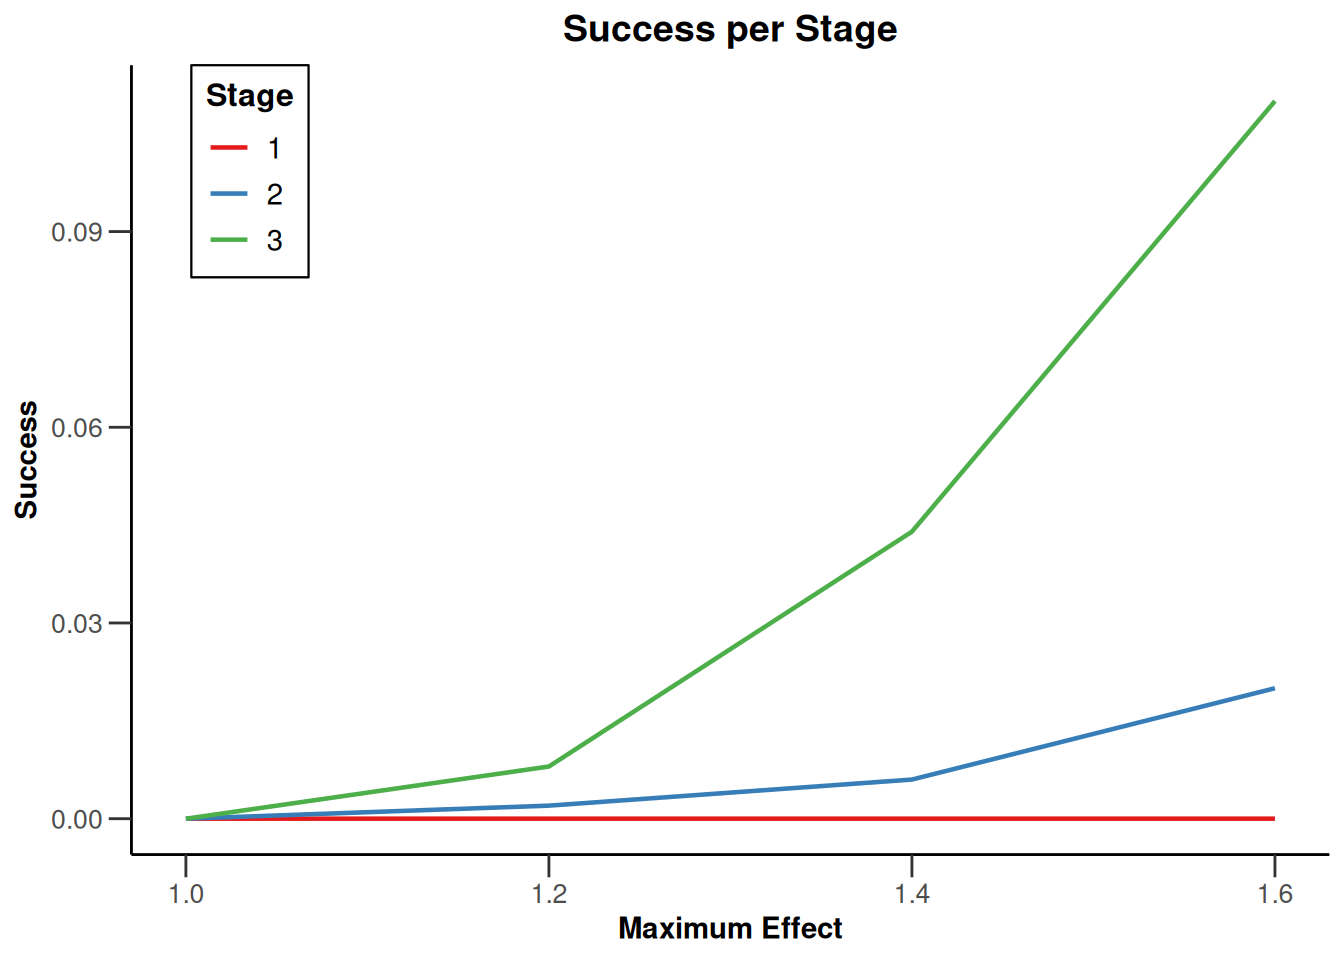
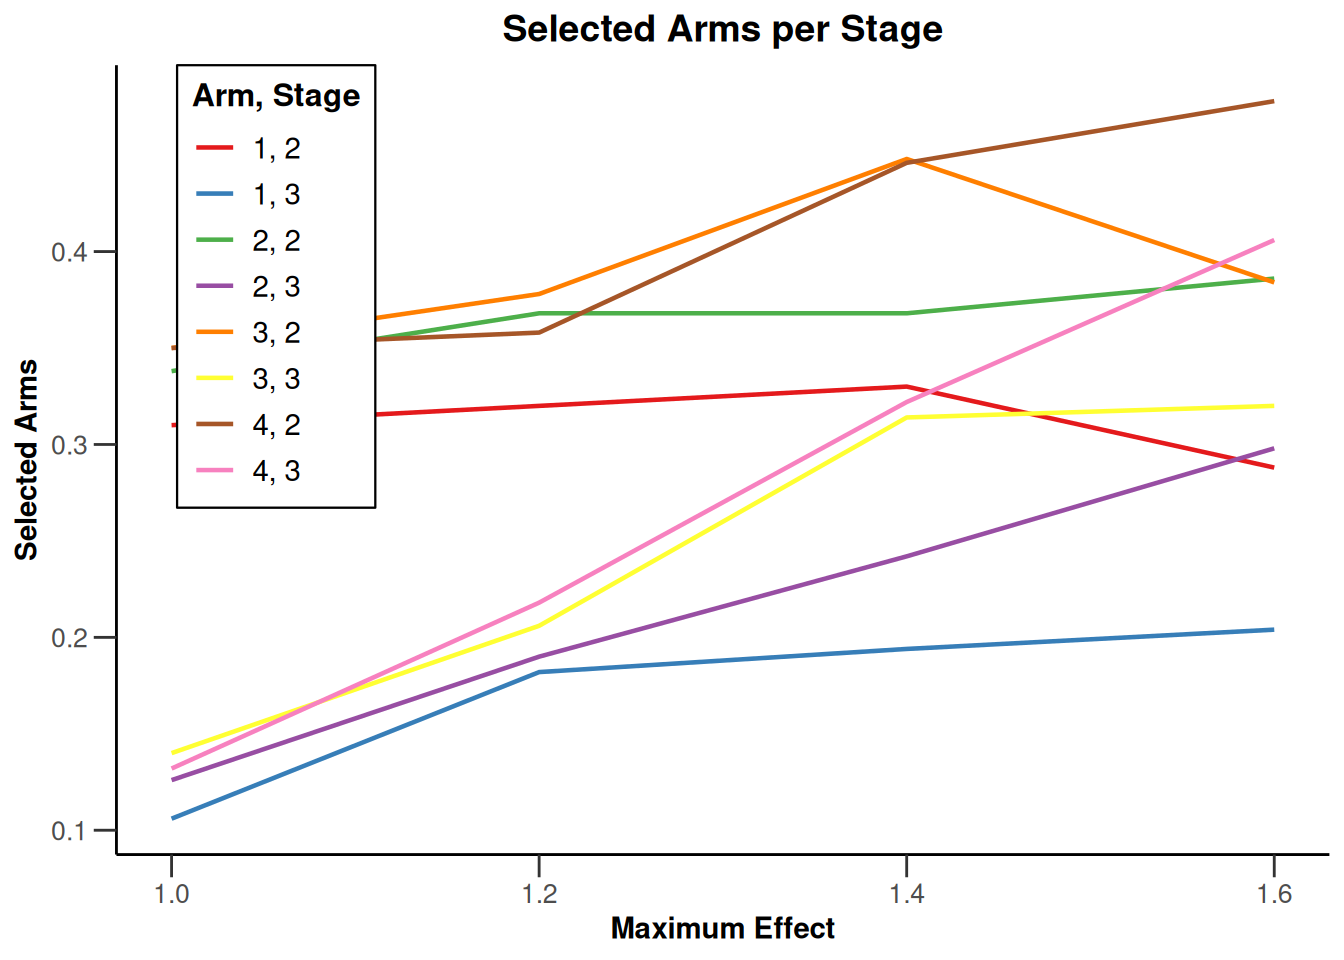
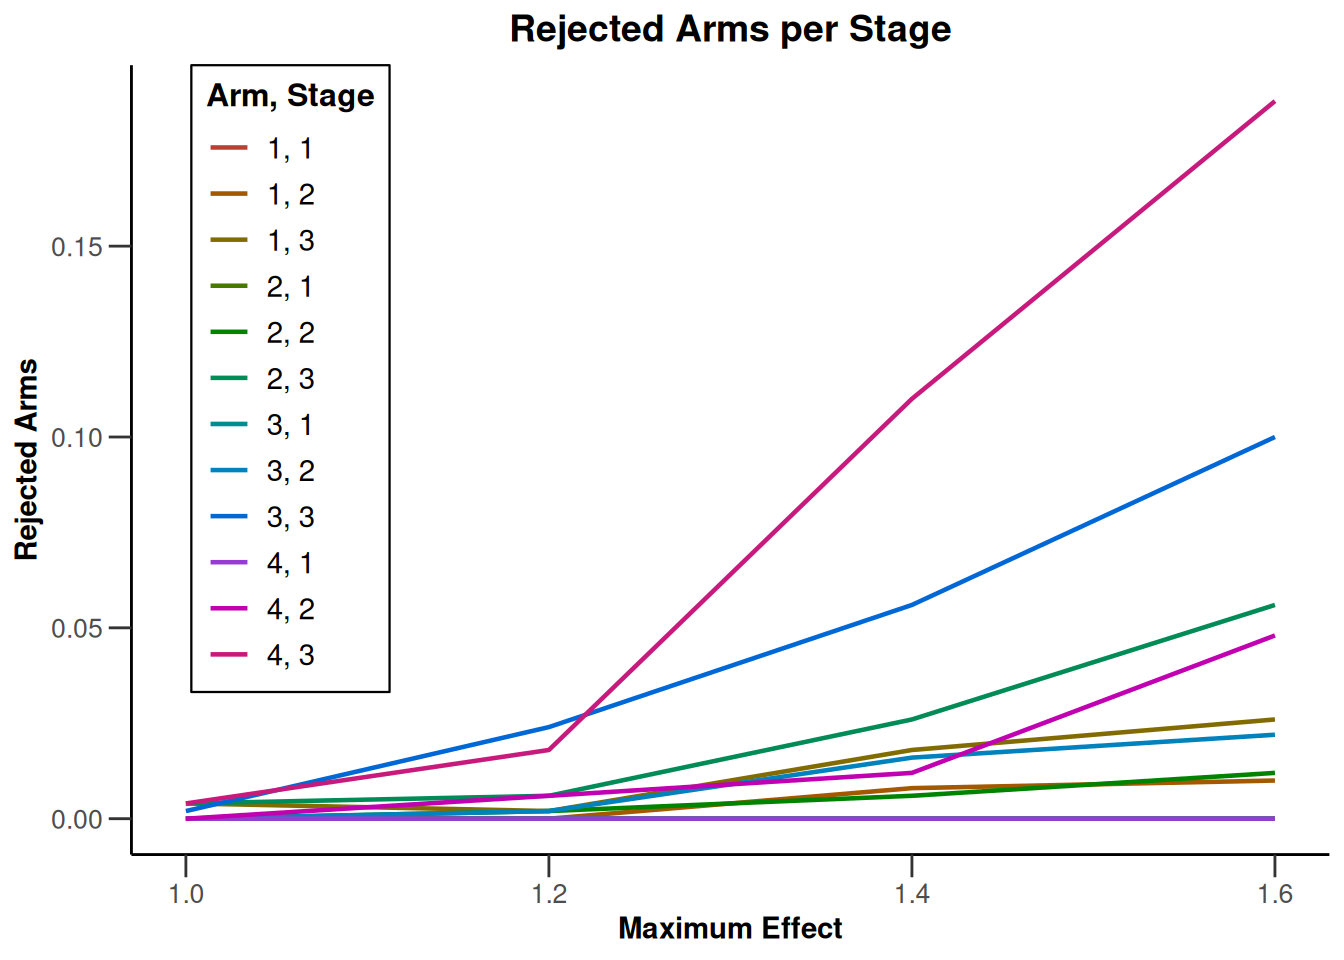
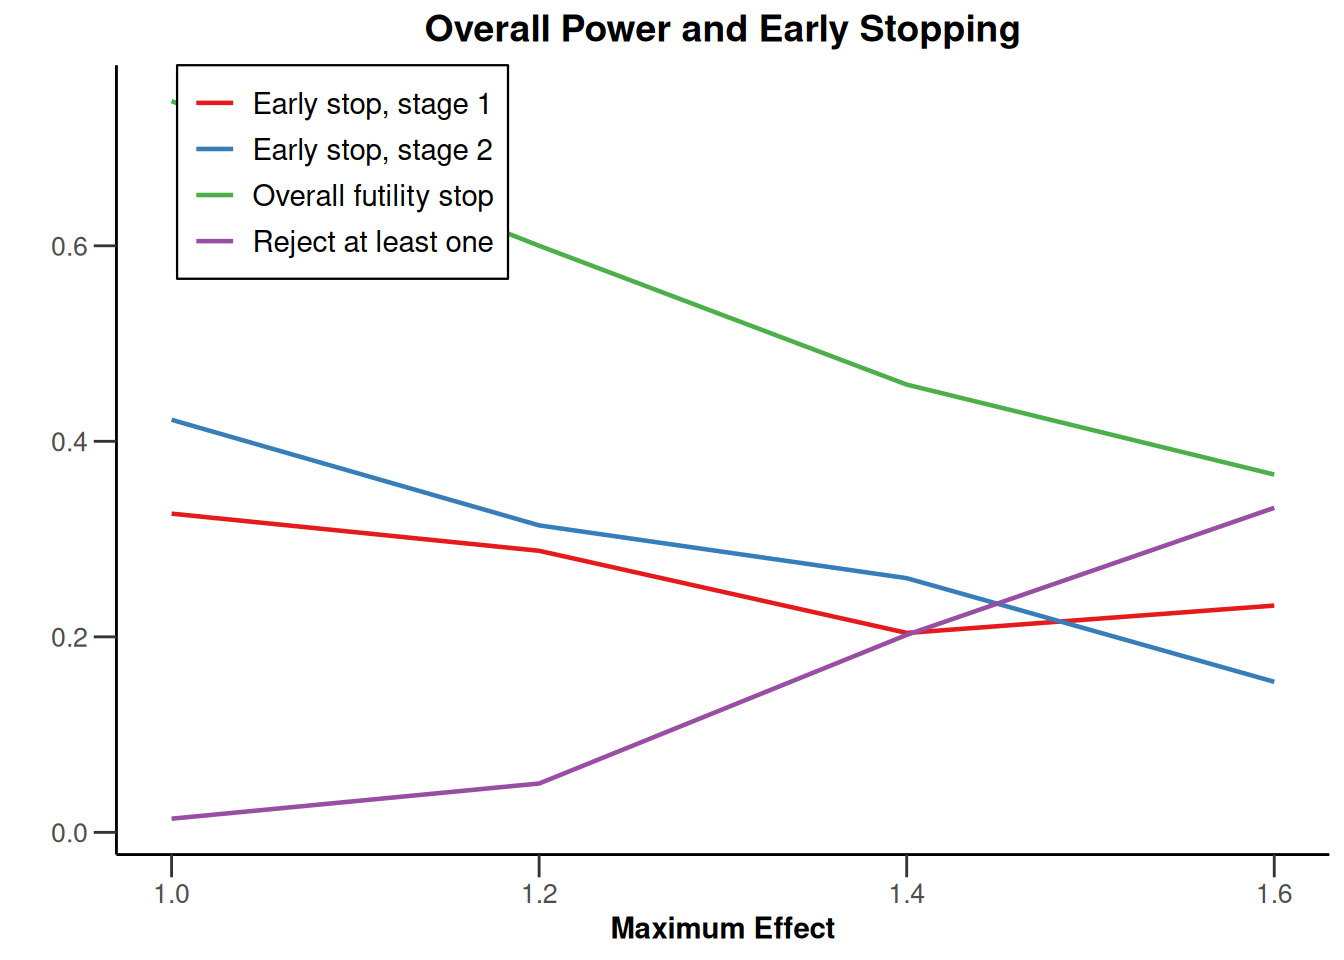
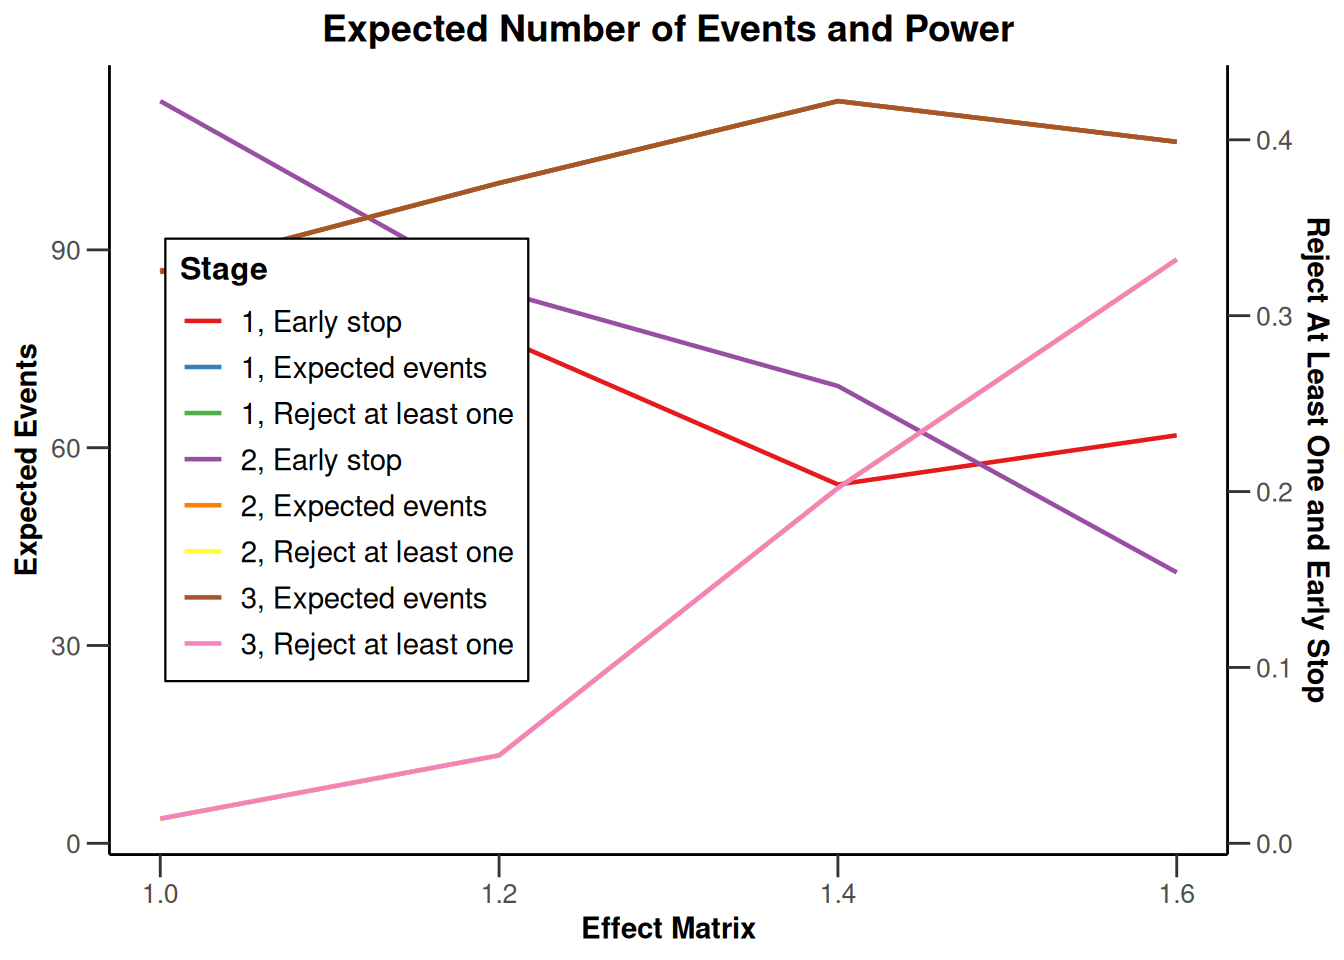
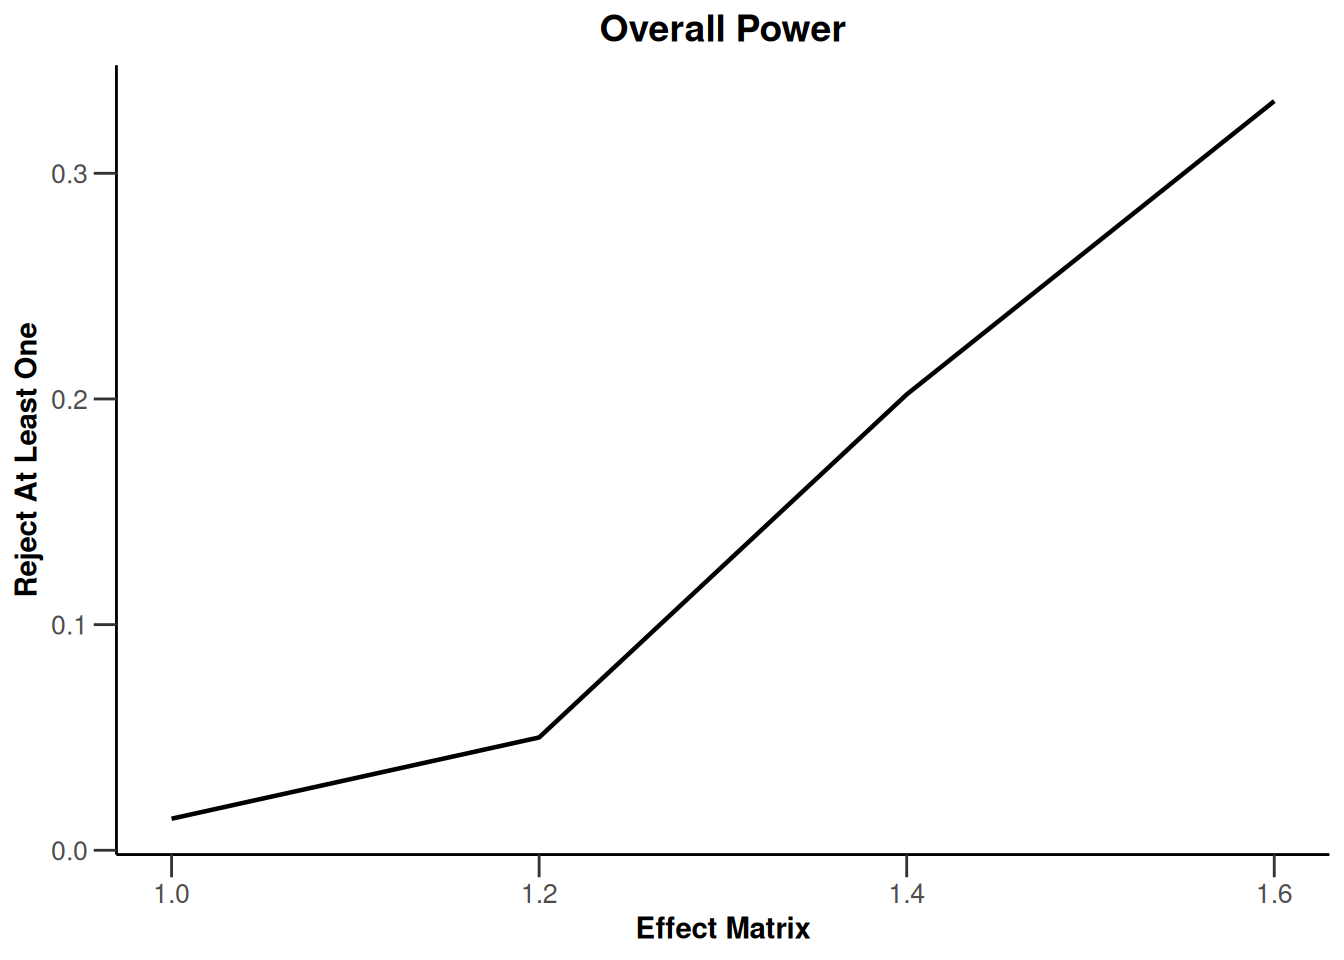
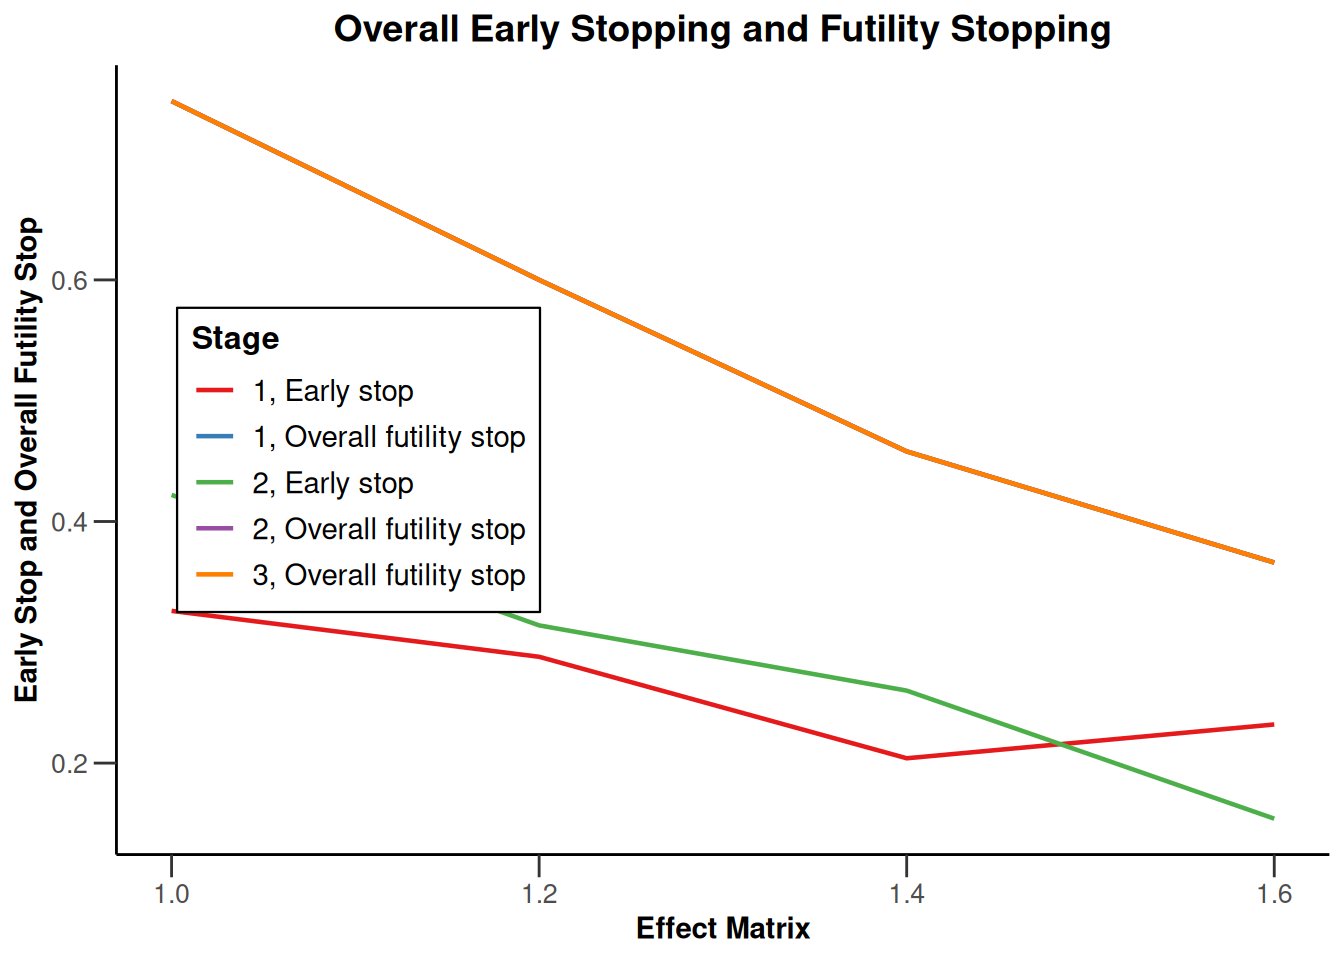
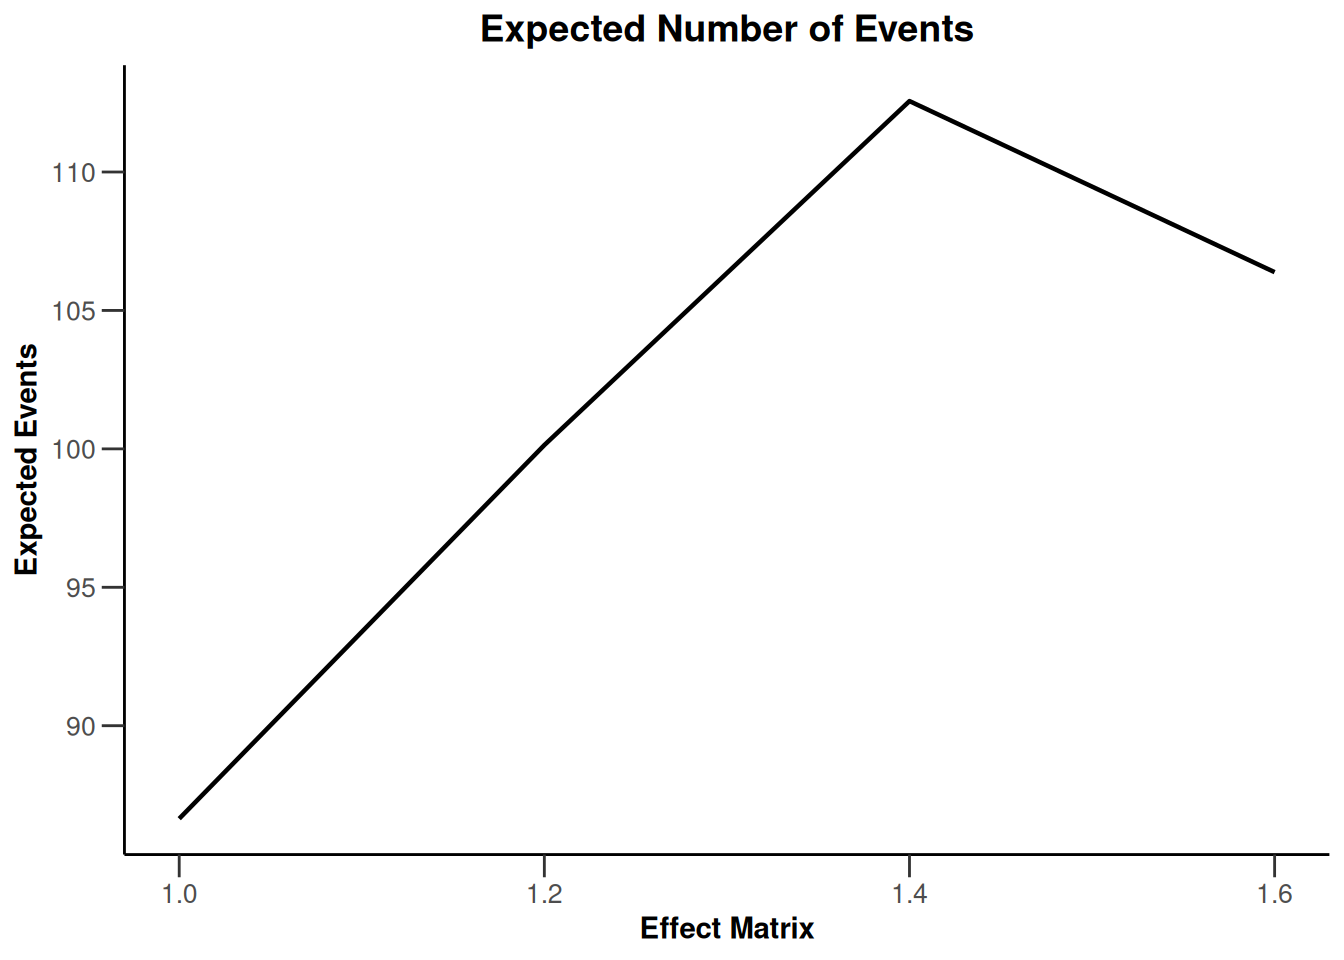
Simulation results multi-arm - survival
getDesignInverseNormal(
    informationRates = c(0.2, 0.6, 1),
    futilityBounds = c(-0.5, 0.5)
) |>
  getSimulationMultiArmSurvival(
    activeArms = 4,
    typeOfSelection = "rBest",
    rValue = 2,
    plannedEvents = c(10, 30, 50),
    omegaMaxVector = seq(1, 1.6, 0.2),
    adaptations = rep(TRUE, 2),
    conditionalPower = 0.8,
    minNumberOfEventsPerStage = c(10, 4, 4),
    maxNumberOfEventsPerStage = c(10, 100, 100),
    maxNumberOfIterations = 500,
    seed = 1234567890
) |>
  plot(type = "all", grid = 0)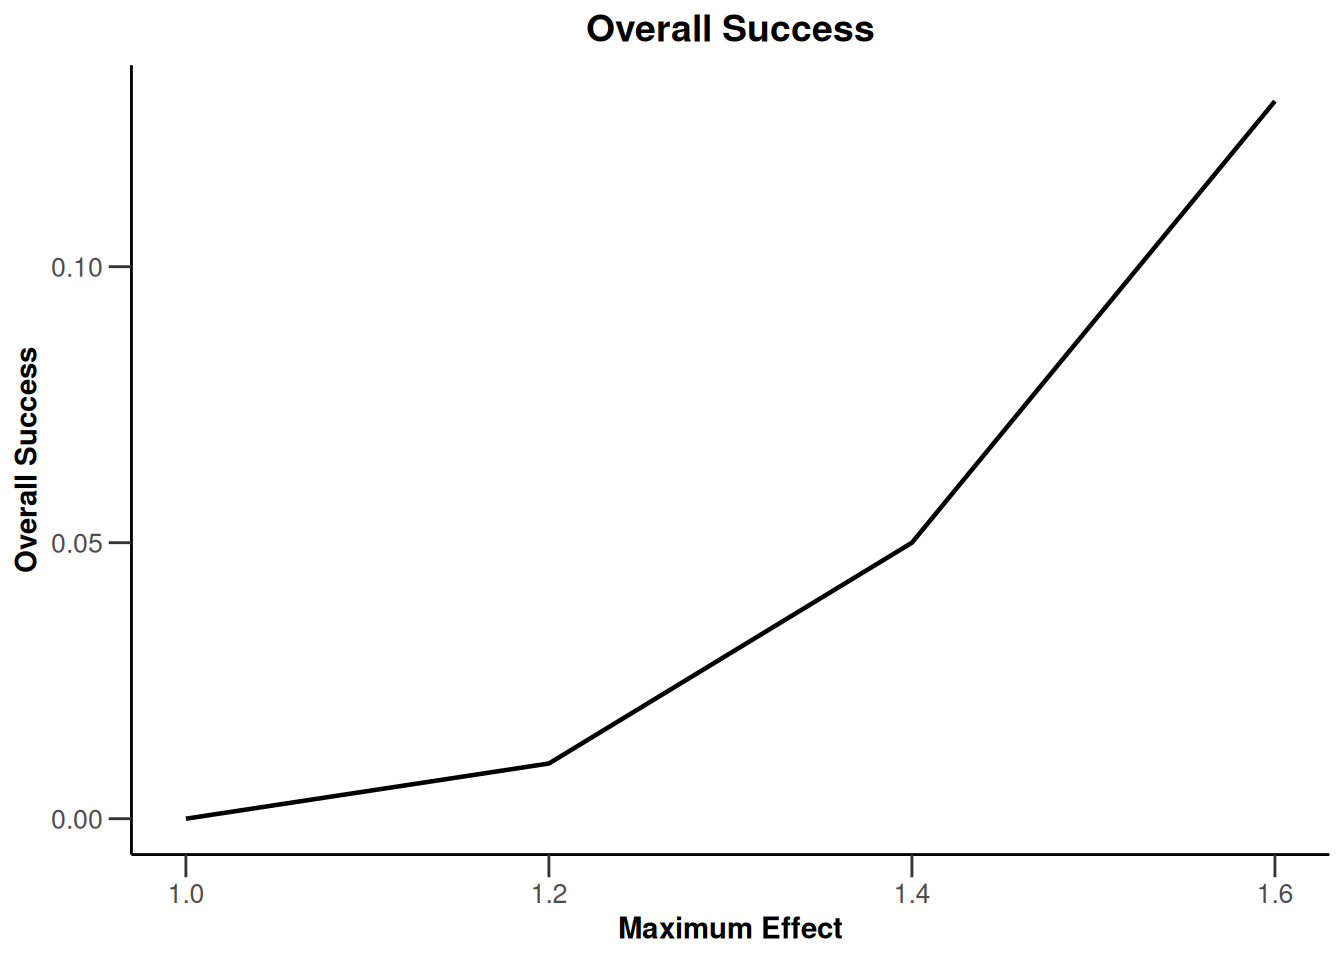
Simulation results enrichment
Simulation results enrichment - means
design <- getDesignInverseNormal(
    informationRates = c(0.2, 0.6, 1),
    futilityBounds = c(-0.5, 0.5)
)
# Define subgroups and their prevalences
subGroups <- c("S1", "S12", "S2", "R") # fixed names!
prevalences <- c(0.2, 0.3, 0.4, 0.1)

effectR <- 1.5
effectS12 <- 5
m <- c()
for (effectS1 in seq(0, 5, 5)) {
    for (effectS2 in seq(0, 5, 5)) {
        m <- c(m, effectS1, effectS12, effectS2, effectR)
    }
}
effects <- matrix(m, byrow = TRUE, ncol = 4)
stDev <- 10
# Define effect list
el <- list(
    subGroups = subGroups, prevalences = prevalences,
    stDevs = stDev, effects = effects
)

# Perform simulation
design |>
  getSimulationEnrichmentMeans(
    plannedSubjects = c(10, 30, 50),
    effectList = el,
    adaptations = rep(TRUE, 2),
    conditionalPower = 0.8,
    minNumberOfSubjectsPerStage = c(10, 4, 4),
    maxNumberOfSubjectsPerStage = c(10, 100, 100),
    maxNumberOfIterations = 500,
    seed = 1234567890
) |>
  plot(type = "all", grid = 0)
Simulation results enrichment - rates
design <- getDesignInverseNormal(
    informationRates = c(0.2, 0.6, 1),
    futilityBounds = c(-0.5, 0.5)
)
# Define effect list
subGroups <- c("S", "R")
prevalences <- c(0.4, 0.6)
piControl <- c(0.1, 0.4)
range1 <- piControl[1] + seq(0.0, 0.2, 0.1)
range2 <- piControl[2] + seq(0.0, 0.2, 0.1)
piTreatments <- c()
for (x1 in range1) {
    for (x2 in range2) {
        piTreatments <- c(piTreatments, x1, x2)
    }
}
el <- list(
    subGroups = subGroups,
    prevalences = prevalences,
    piControl = piControl,
    piTreatments = matrix(piTreatments,
        byrow = TRUE, ncol = 2
    )
)

# Perform simulation
design |>
  getSimulationEnrichmentRates(
    plannedSubjects = c(10, 30, 50),
    effectList = el,
    maxNumberOfIterations = 500,
    seed = 1234567890
) |>
  plot(type = "all", grid = 0)
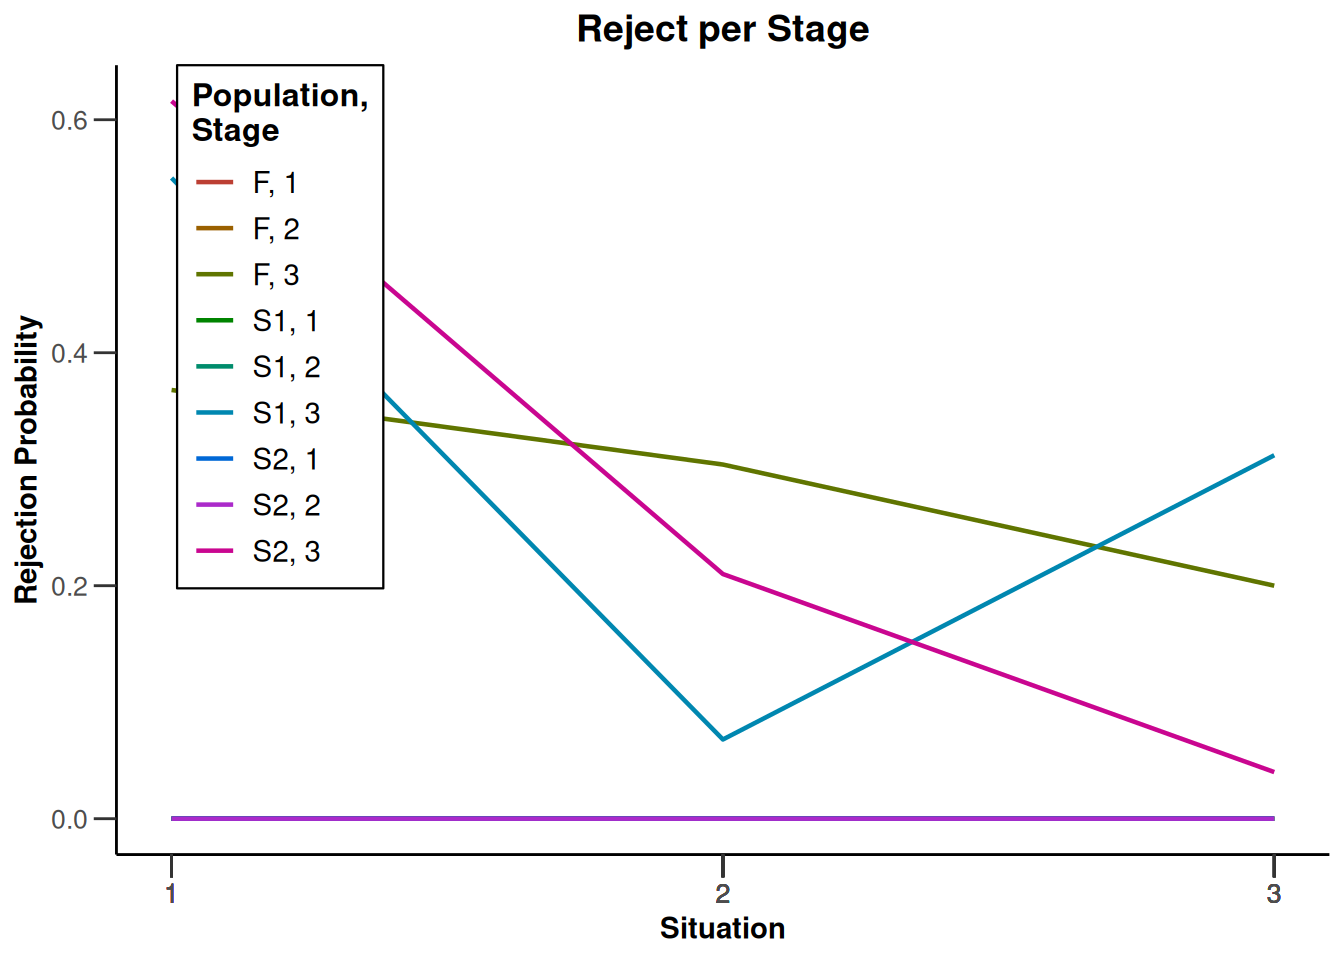
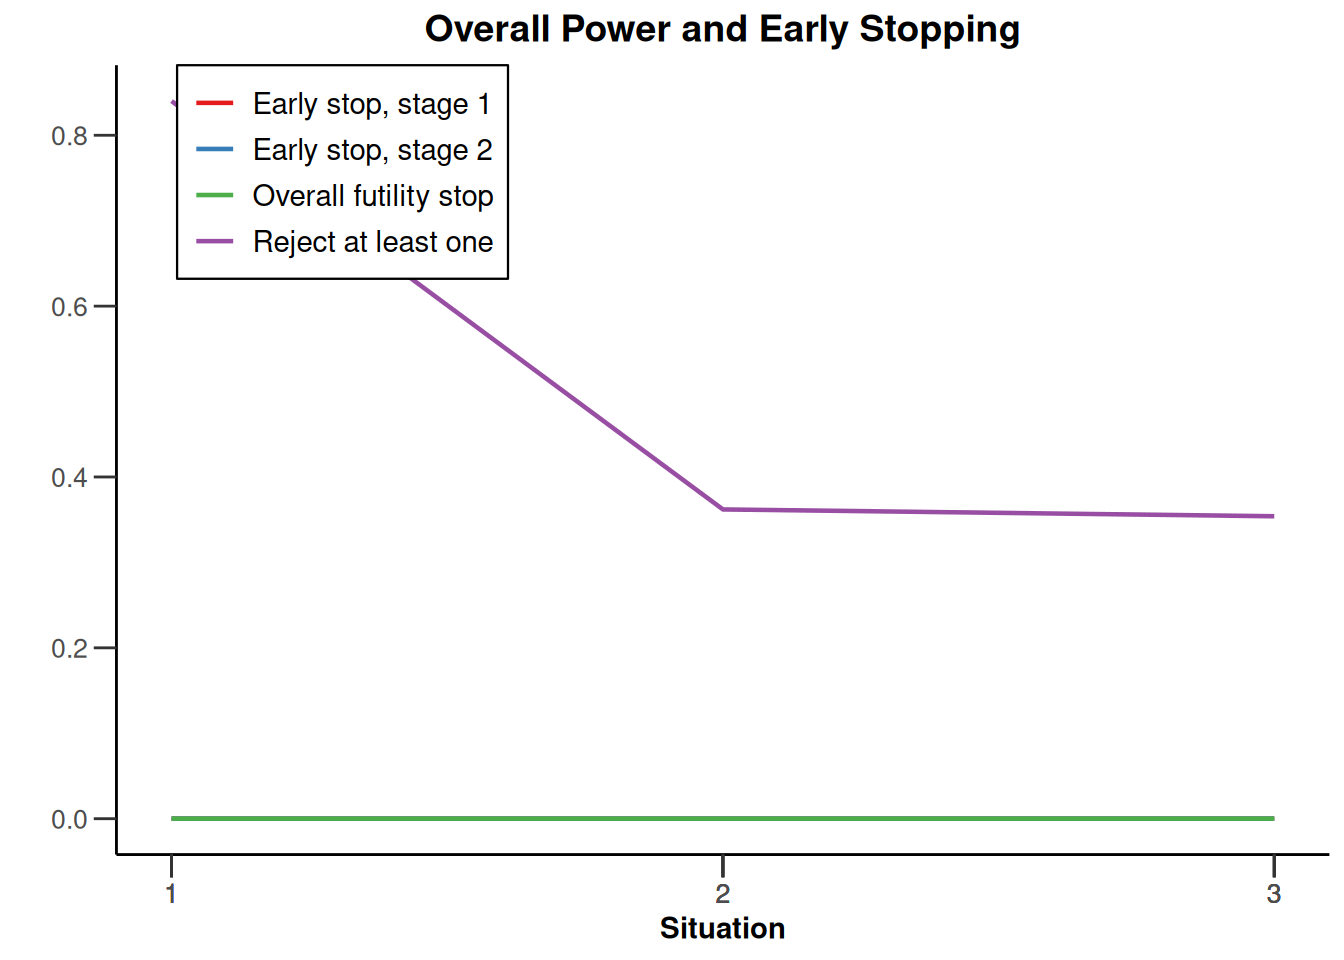
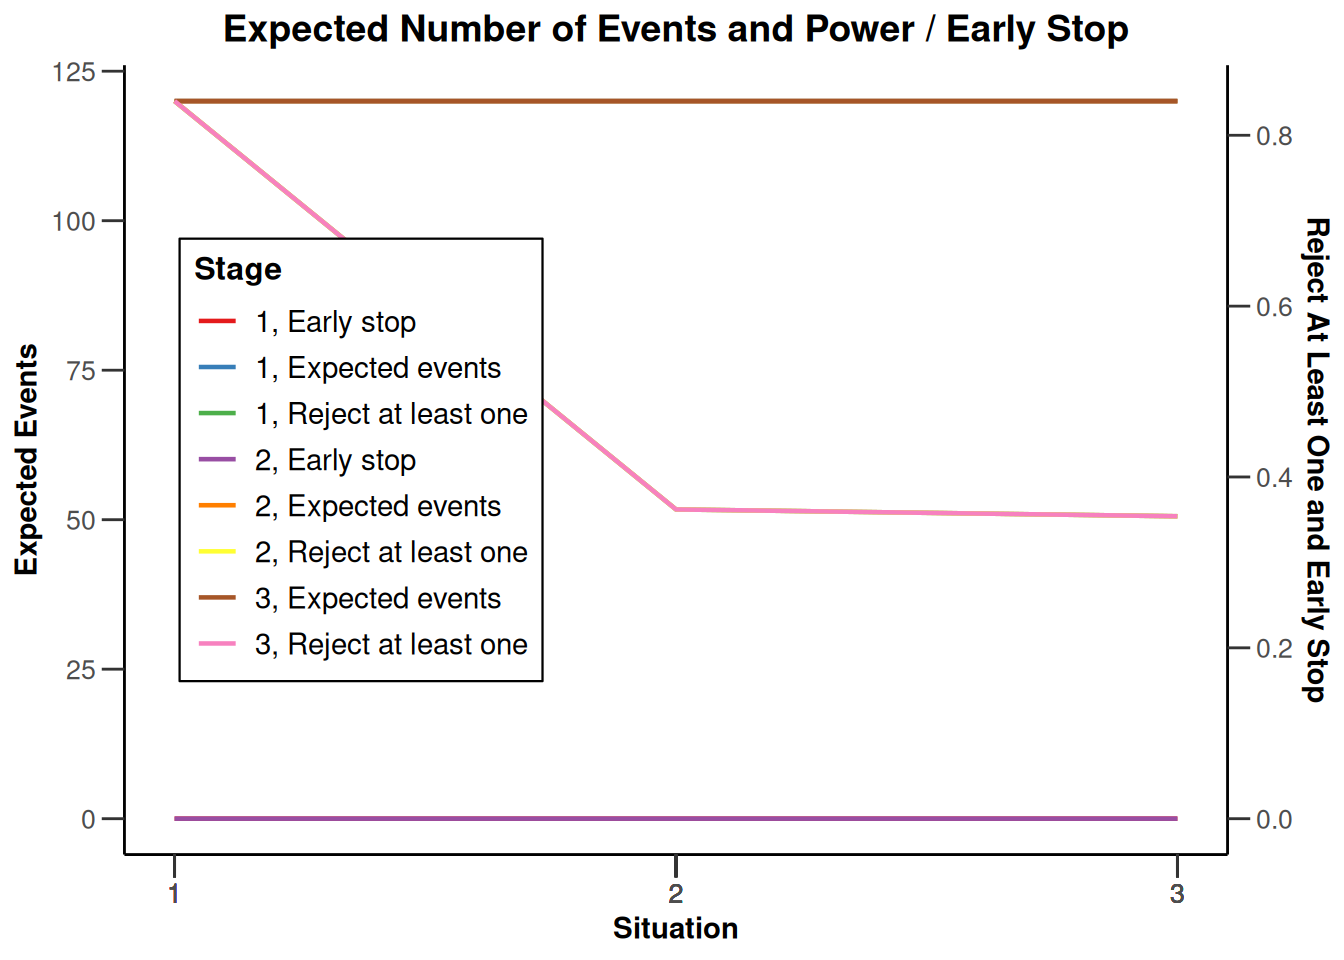
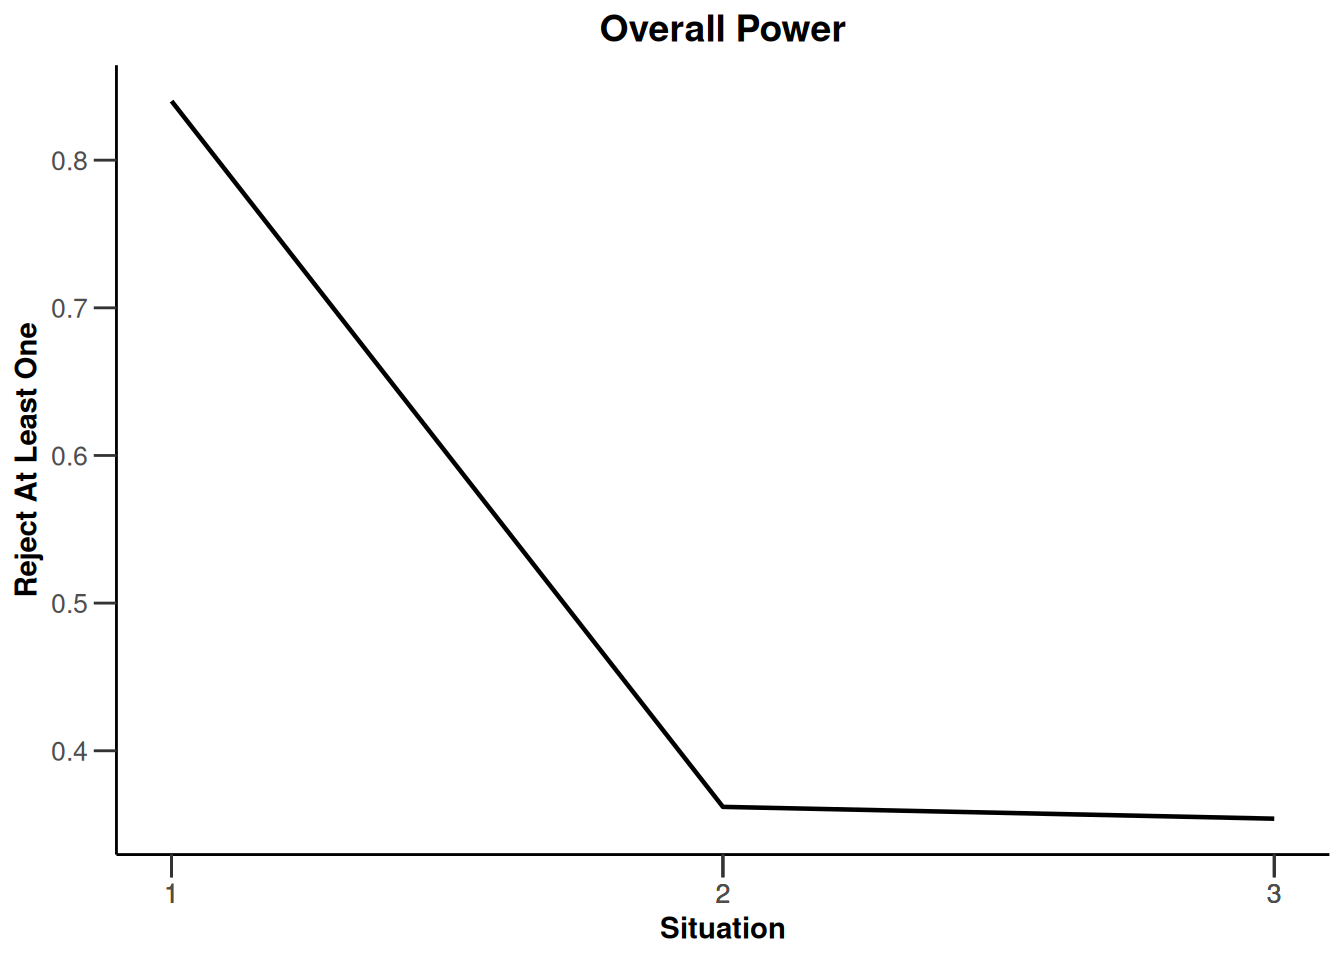
Simulation results enrichment - survival
# Define subgroups and their prevalences
subGroups <- c("S1", "S2", "S12", "R") # fixed names!
prevalences <- c(0.2, 0.3, 0.4, 0.1)

piControls <- c(0.2, 0.4, 0.15, 0.3)
effect <- c(-0.05, -0.02, -0.10, -0.10)
piTreatments <- piControls + effect

hr <- log(1 - piTreatments) / log(1 - piControls)

# Define effect list
el <- list(
    subGroups = subGroups, prevalences = prevalences,
    piControls = piControls, hazardRatios = matrix(rep(hr, 3), nrow = 3)
)

# Perform simulation
getDesignInverseNormal(
    typeOfDesign = "noEarlyEfficacy") |>
  getSimulationEnrichmentSurvival(
    effectList = el,
    typeOfSelection = "rbest",
    rValue = 2,
    intersectionTest = "Simes",
    plannedEvents = c(30, 80, 120),
    maxNumberOfIterations = 500,
    directionUpper = FALSE
) |>
  plot(type = "all", grid = 0)
System: rpact 4.4.0.9305, R version 4.6.0 (2026-04-24), platform: x86_64-pc-linux-gnu
To cite R in publications use:
R Core Team (2026). R: A Language and Environment for Statistical Computing. R Foundation for Statistical Computing, Vienna, Austria. doi:10.32614/R.manuals https://doi.org/10.32614/R.manuals. https://www.R-project.org/.
To cite package ‘rpact’ in publications use:
Wassmer G, Pahlke F (2026). rpact: Confirmatory Adaptive Clinical Trial Design and Analysis. R package version 4.4.0.9305. doi:10.32614/CRAN.package.rpact
Wassmer G, Brannath W (2025). Group Sequential and Confirmatory Adaptive Designs in Clinical Trials, 2nd edition. Springer, Cham, Switzerland. ISBN 978-3-031-89668-2. doi:10.1007/978-3-031-89669-9 https://doi.org/10.1007/978-3-031-89669-9.