library(rpact)
packageVersion("rpact") # version should be version 3.0 or laterHow to Create Admirable Plots with rpact
Utilities
Sample size
Power simulation
Preparation
First, load the rpact package
[1] '4.0.0'Design plots
One-sided design with futility bounds
design <- getDesignGroupSequential(
    kMax = 3,
    typeOfDesign = "OF", sided = 1,
    futilityBounds = c(0, 0.1)
)

plot(design, type = 1)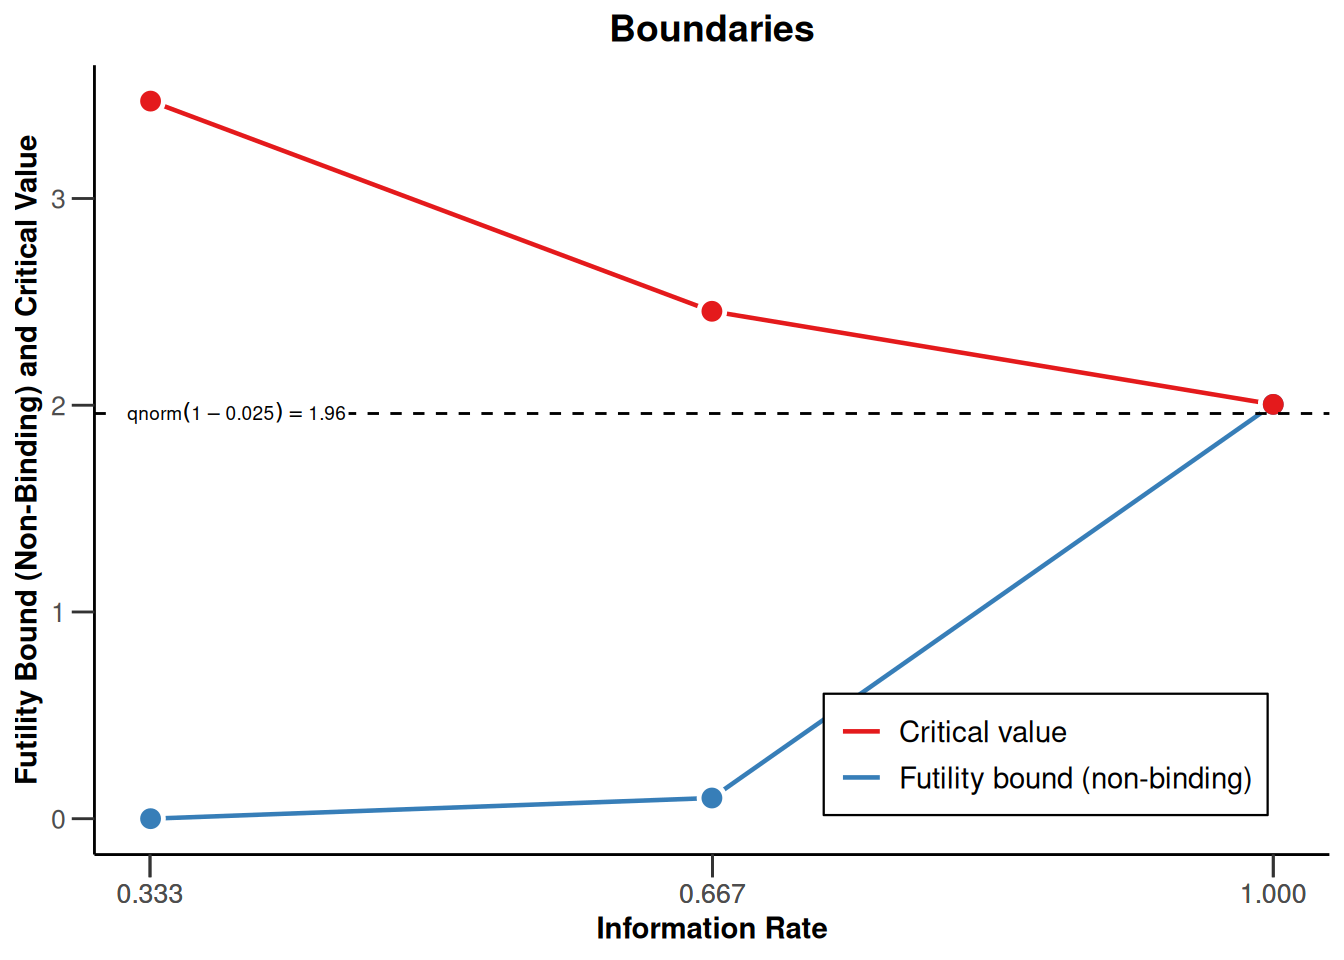
plot(design, type = 5, nMax = 10)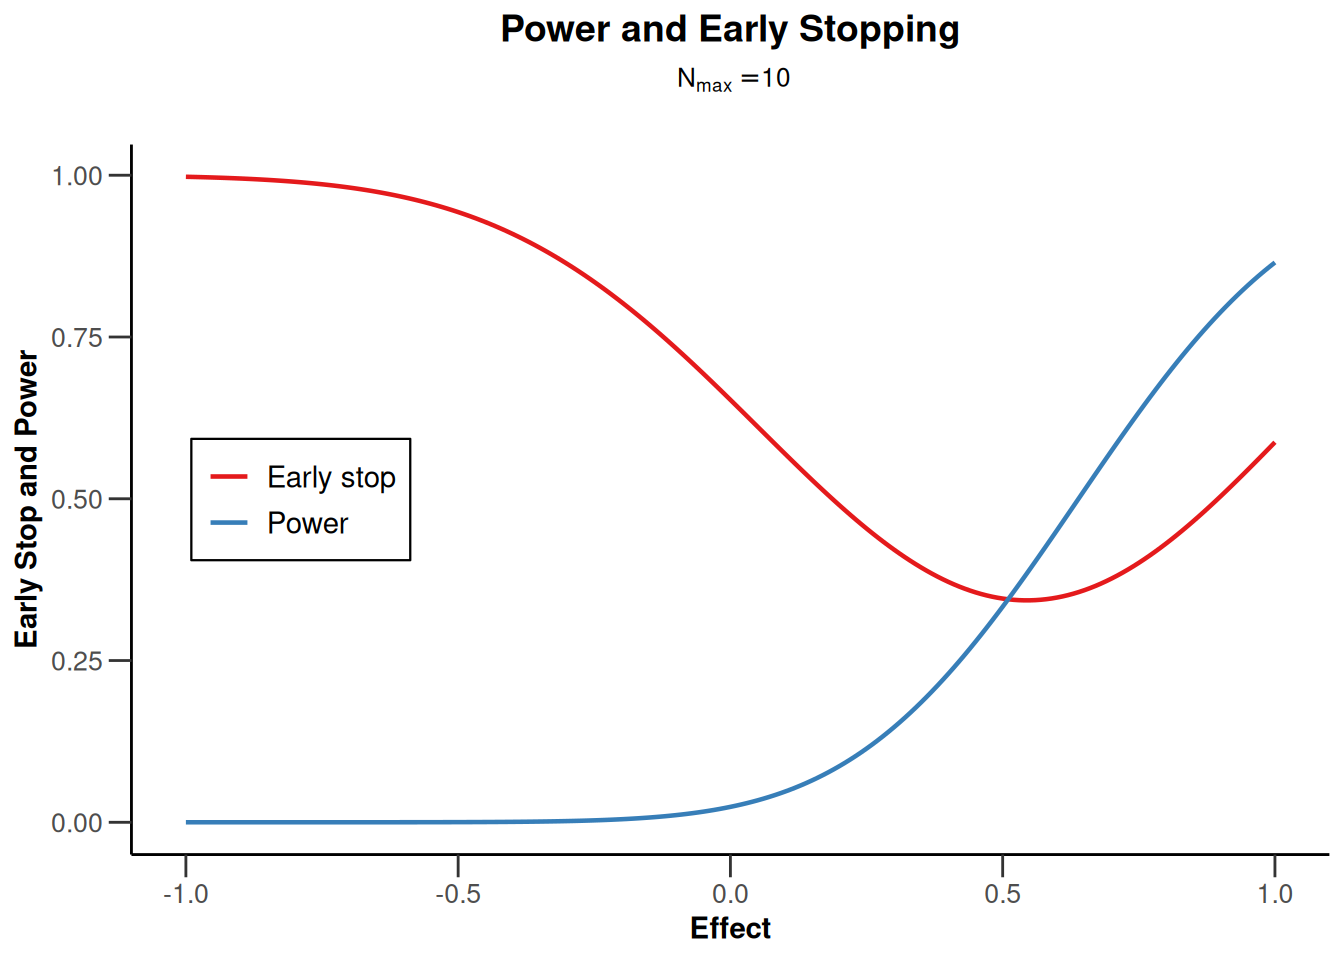
plot(design, type = 6, nMax = 10)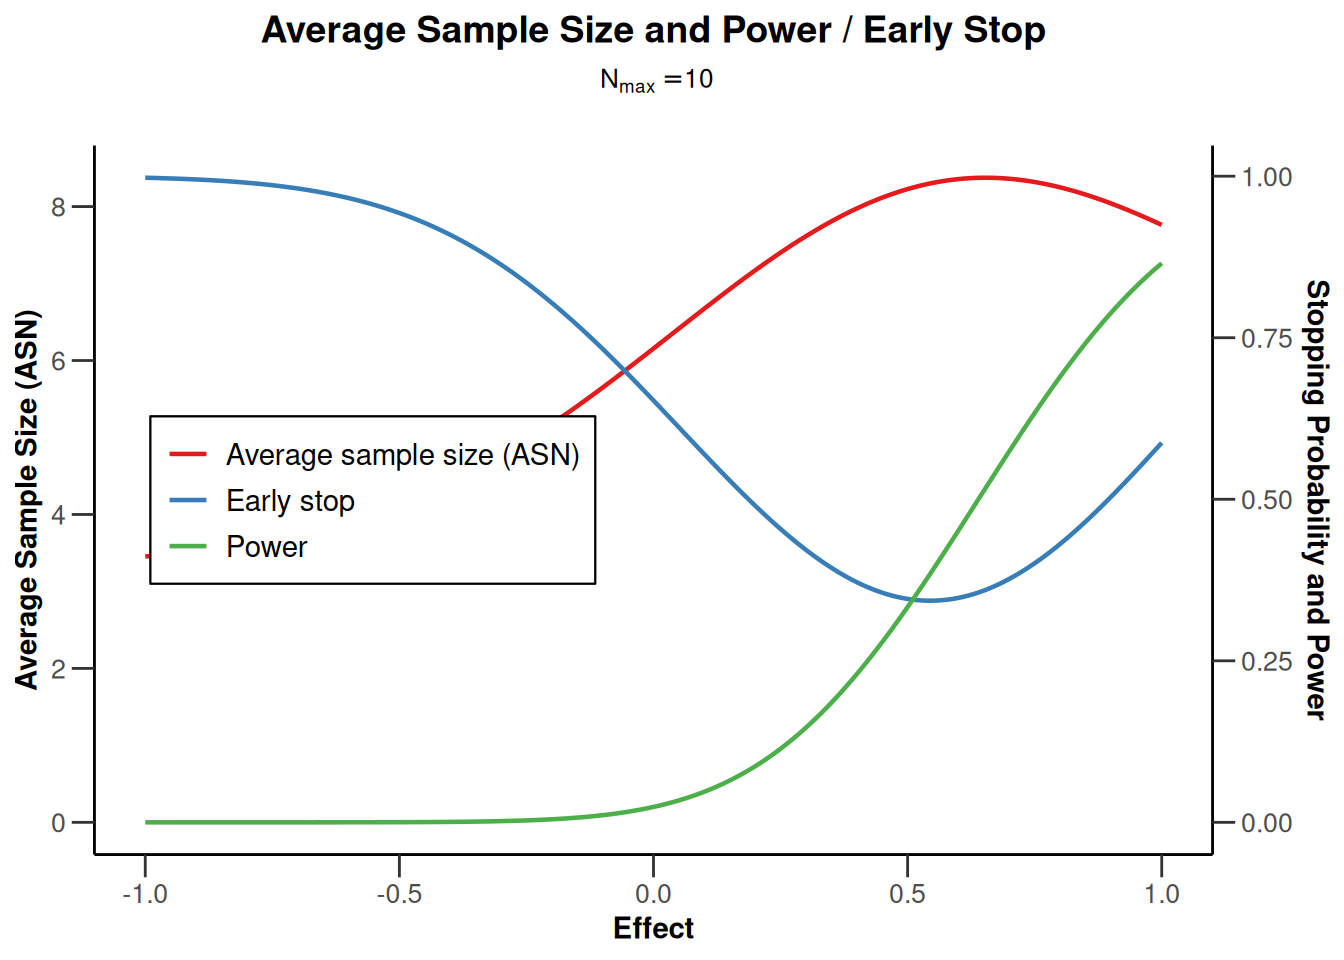
Two-sided design
design <- getDesignGroupSequential(
    kMax = 4, typeOfDesign = "OF", sided = 2, twoSidedPower = TRUE
)

plot(design, type = 1)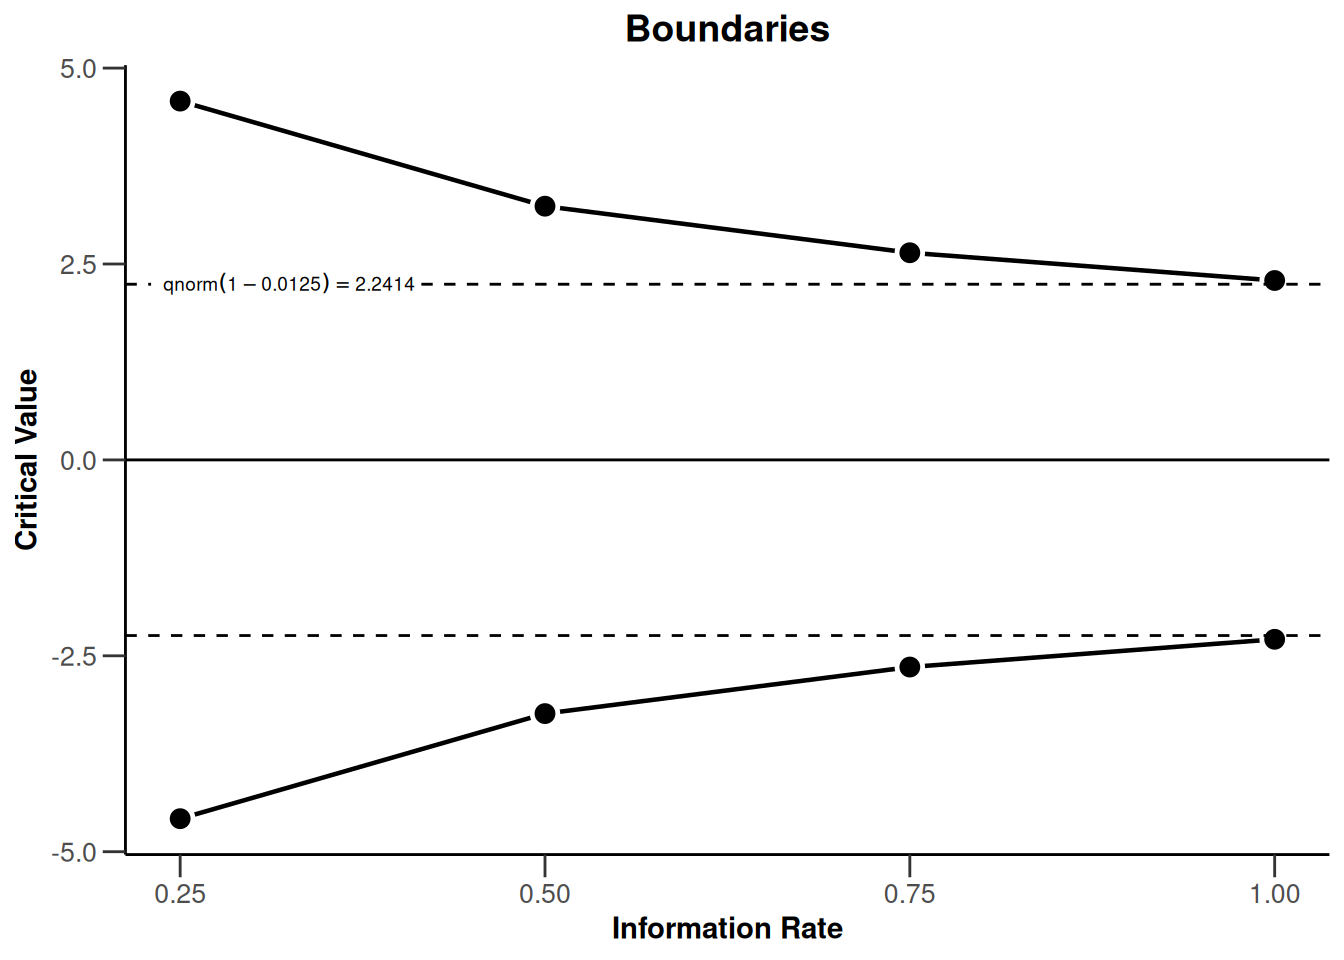
plot(design, type = 5, nMax = 10)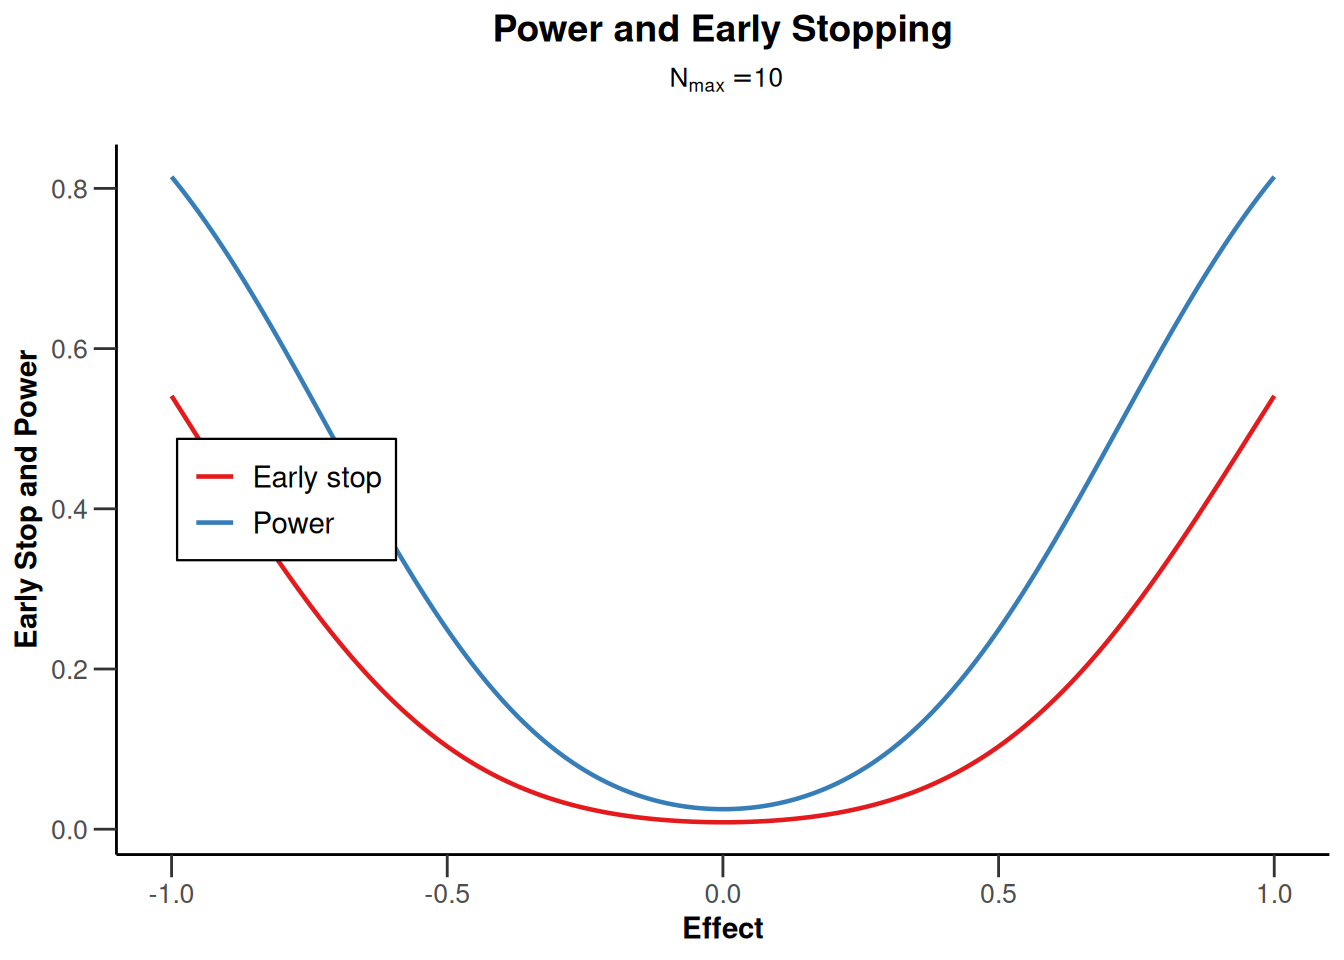
plot(design, type = 6, nMax = 10)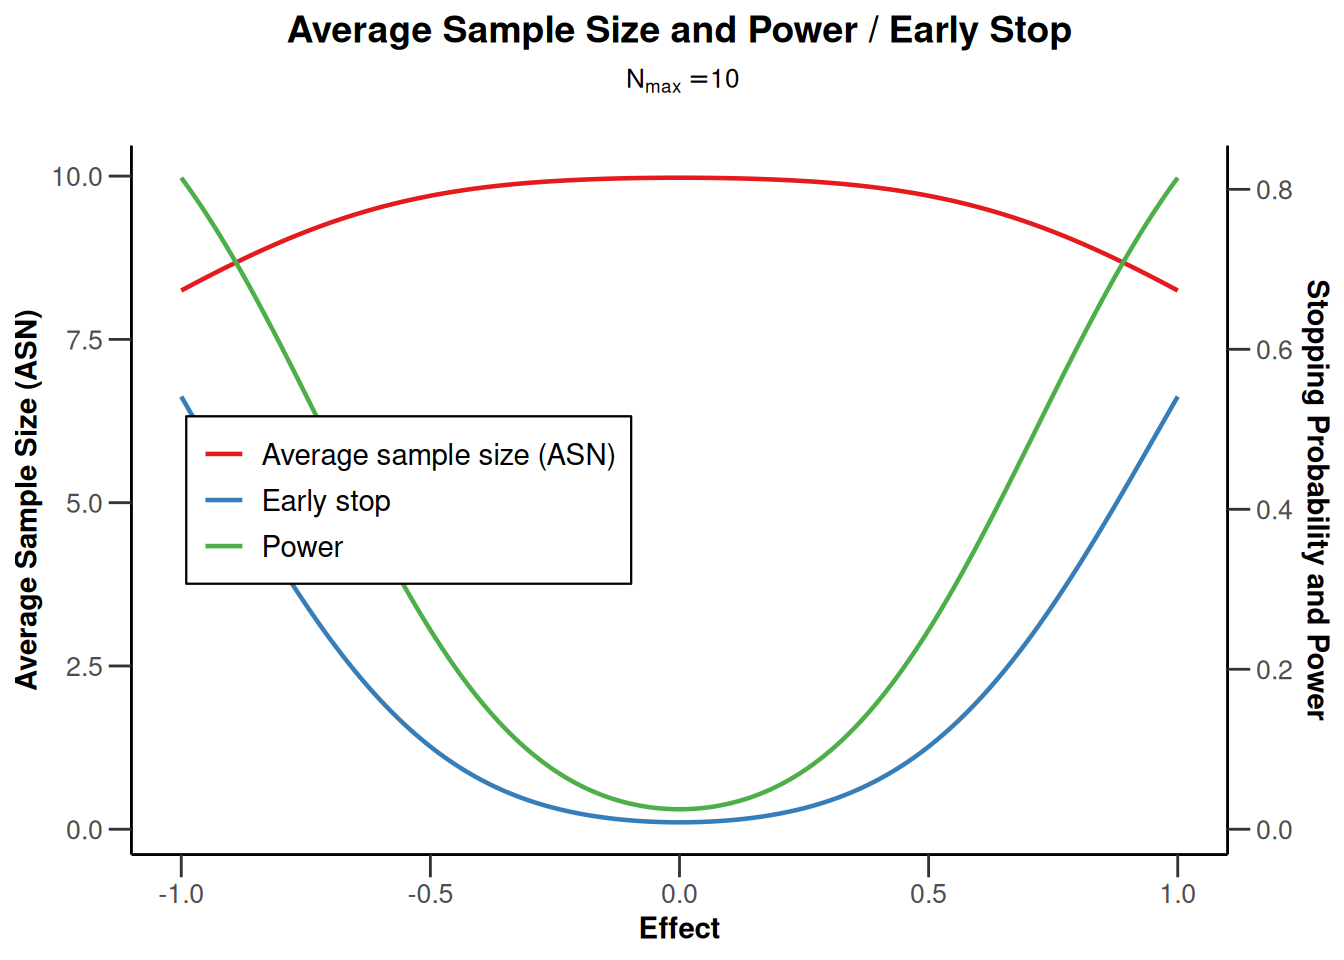
Two-sided design with futility bound
design <- getDesignGroupSequential(
    beta = 0.05, kMax = 4, typeOfDesign = "asOF",
    typeBetaSpending = "bsOF", sided = 2
)

plot(design, type = 1)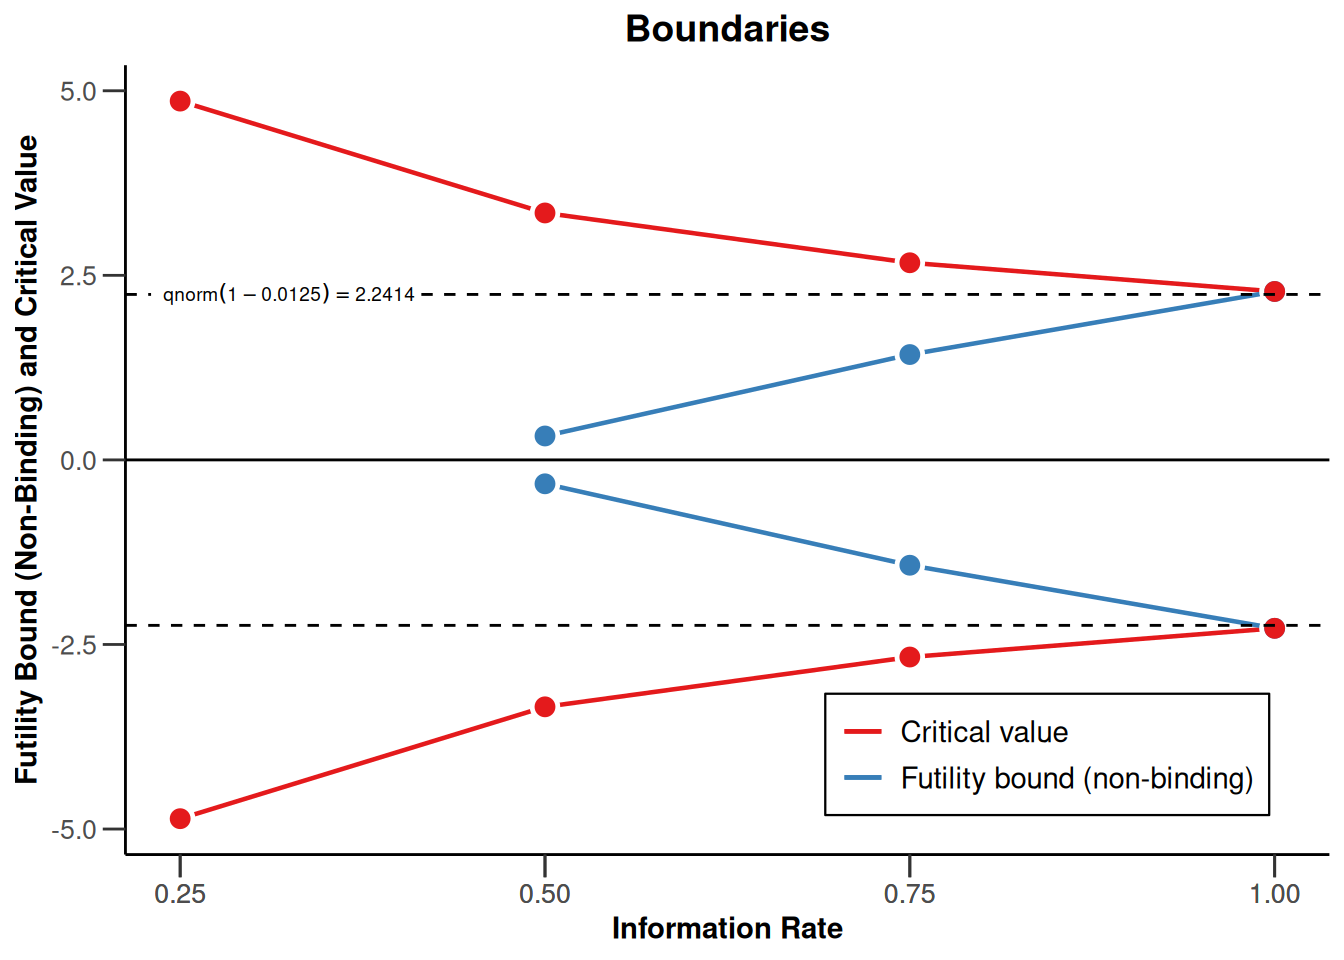
plot(design, type = 5, nMax = 10)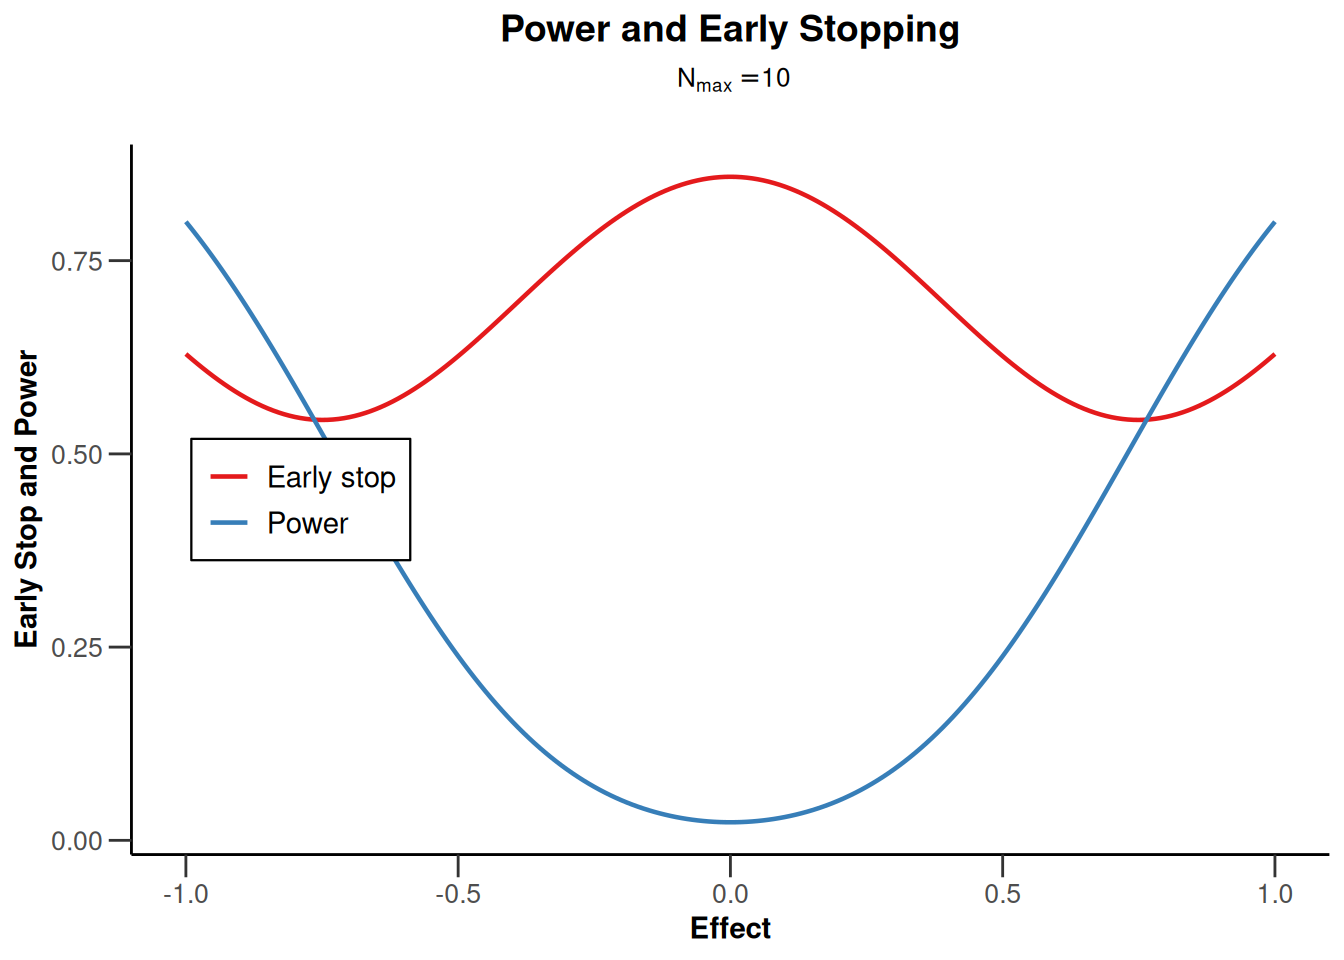
plot(design, type = 6, nMax = 10)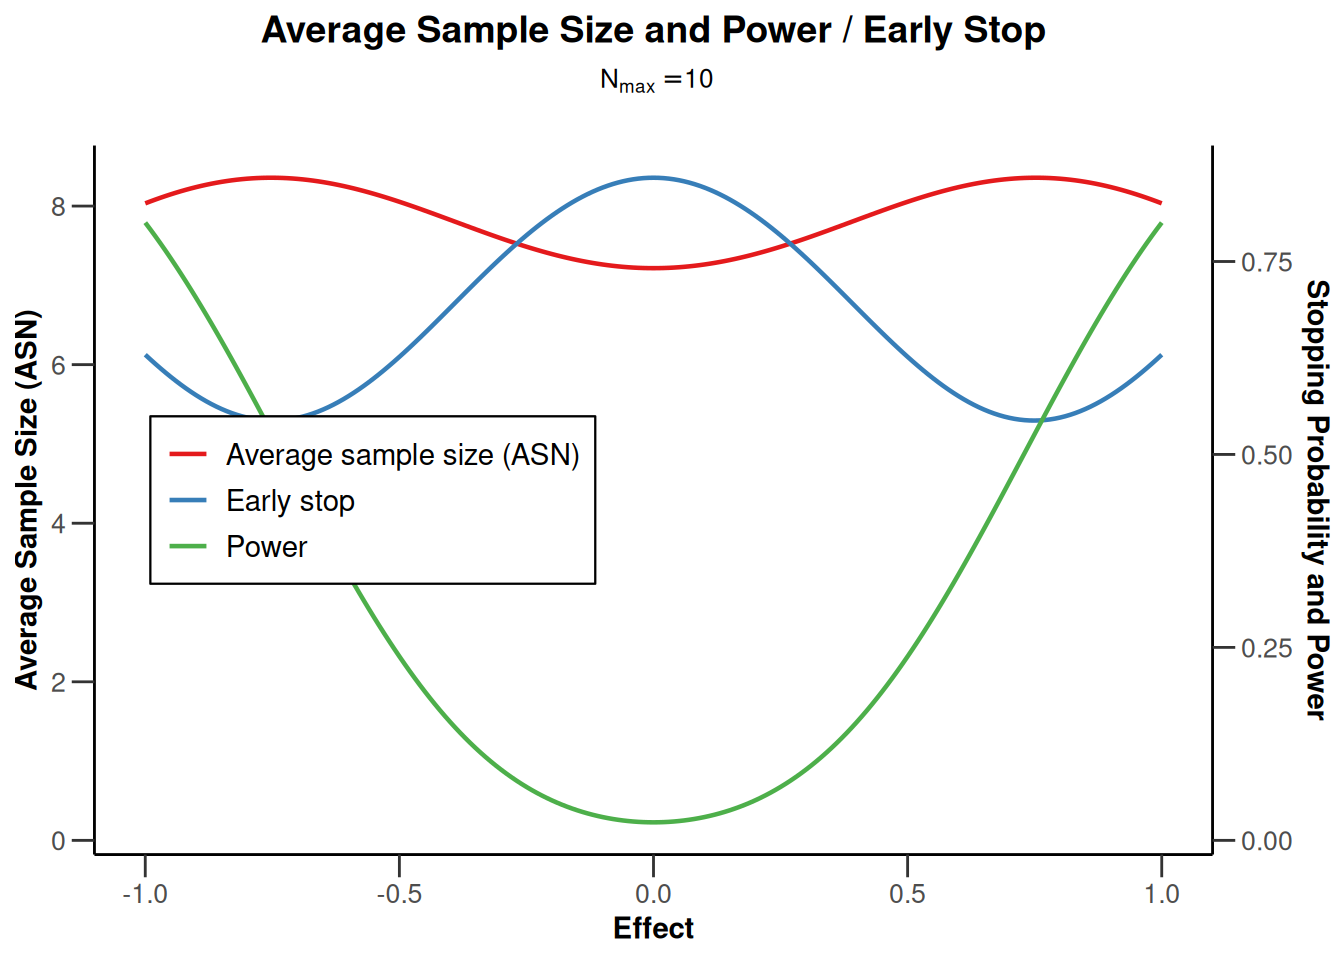
Sample size plots
Sample size means (continuous endpoint)
Sample size means for a one-sided design with futility bounds
sampleSizeMeans1 <- getSampleSizeMeans(
    getDesignGroupSequential(
        sided = 1,
        futilityBounds = c(0, 0.2)
    )
)

plot(sampleSizeMeans1, type = 1)
Warning: Only the first 'alternative' (0.2) was used for plotting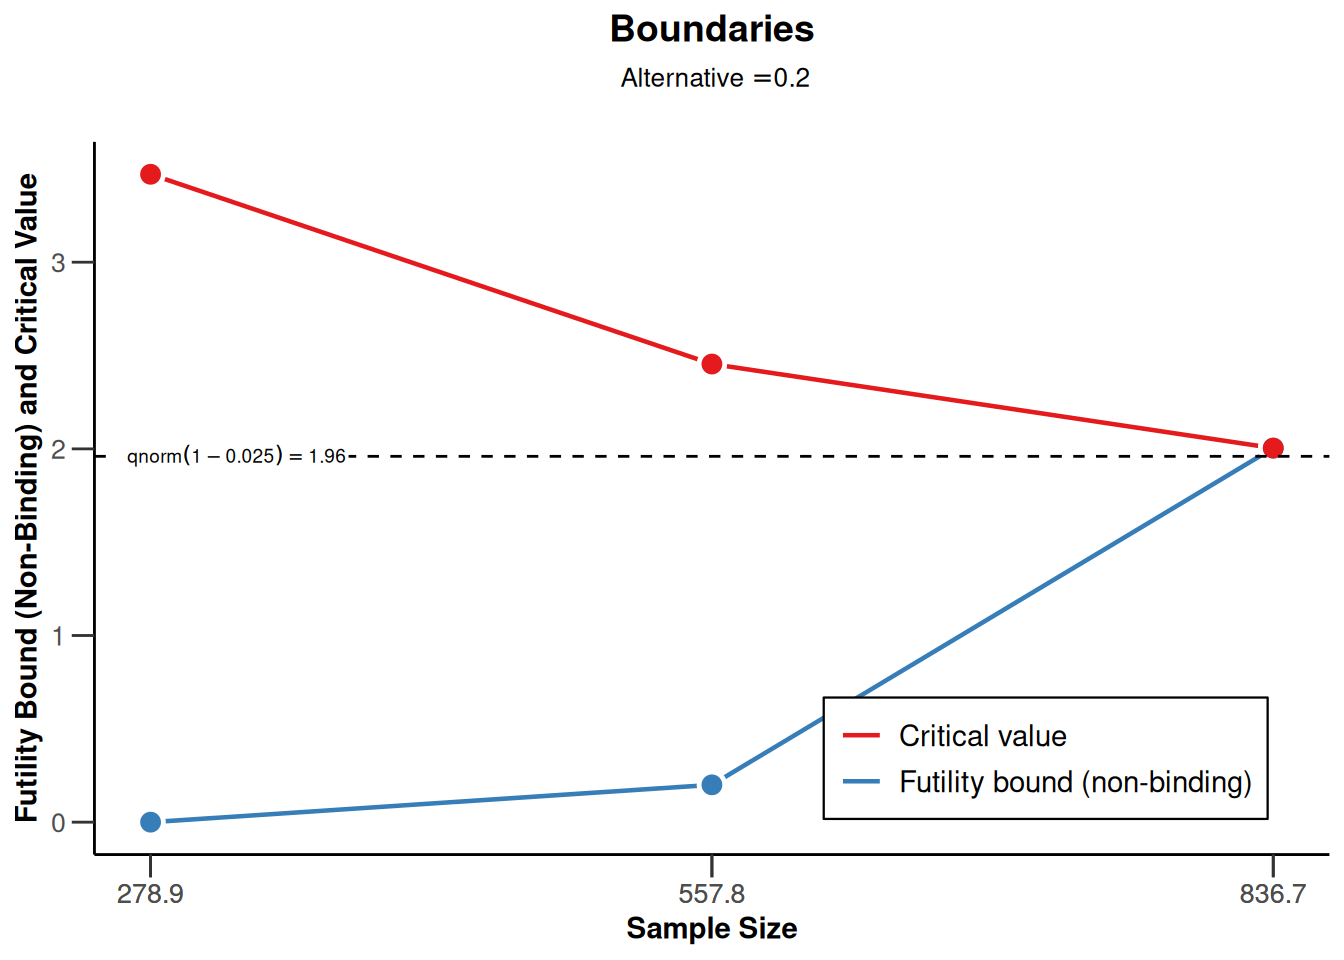
plot(sampleSizeMeans1, type = 2)Warning: Only the first 'alternative' (0.2) was used for plotting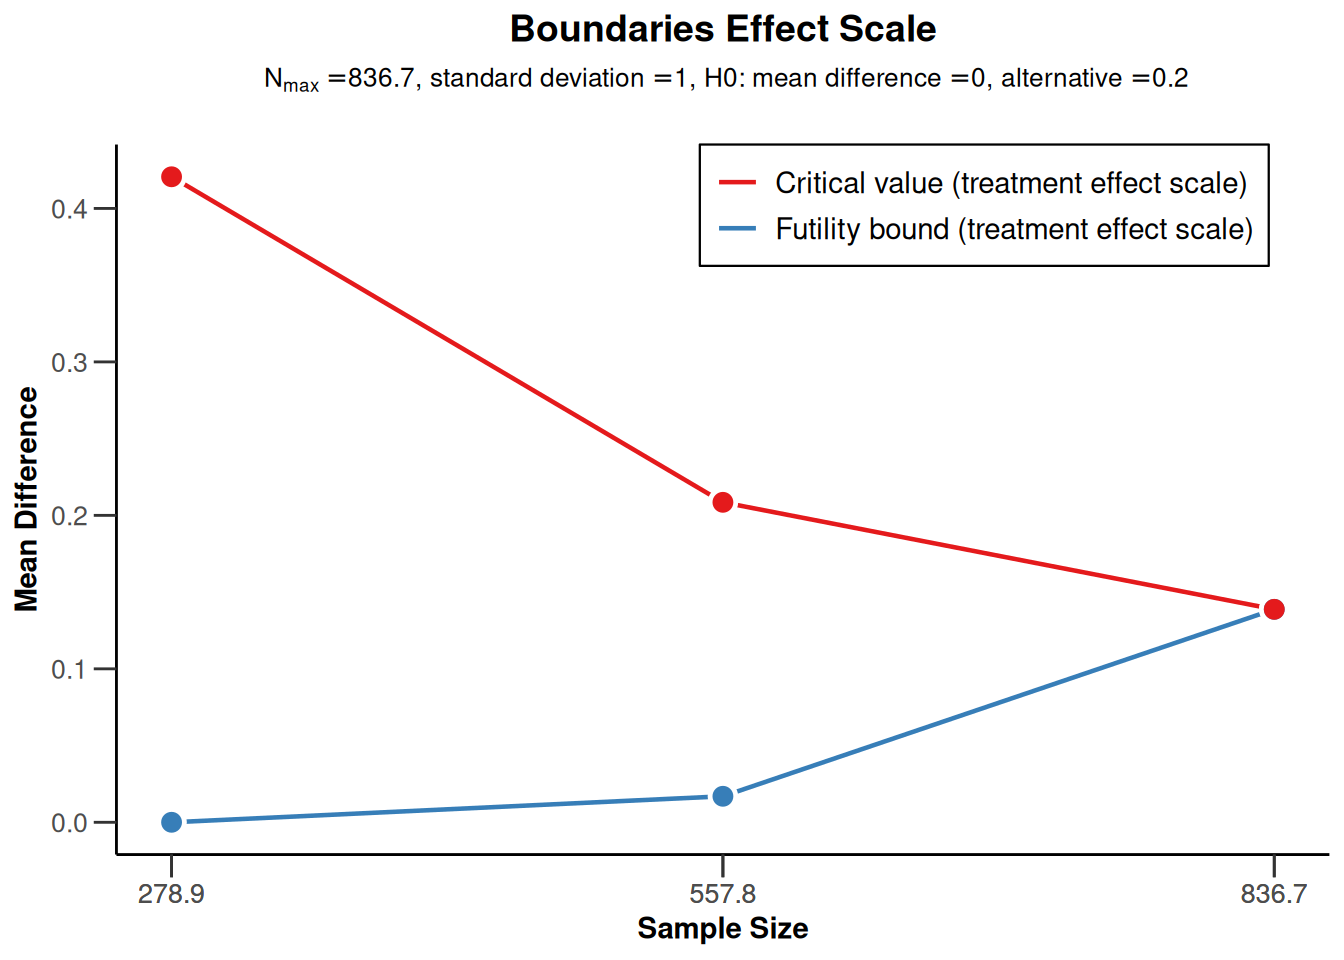
Sample size means for a two-sided design
sampleSizeMeans2 <- getSampleSizeMeans(
    getDesignGroupSequential(sided = 2)
)

plot(sampleSizeMeans2, type = 1)
Warning: Only the first 'alternative' (0.2) was used for plotting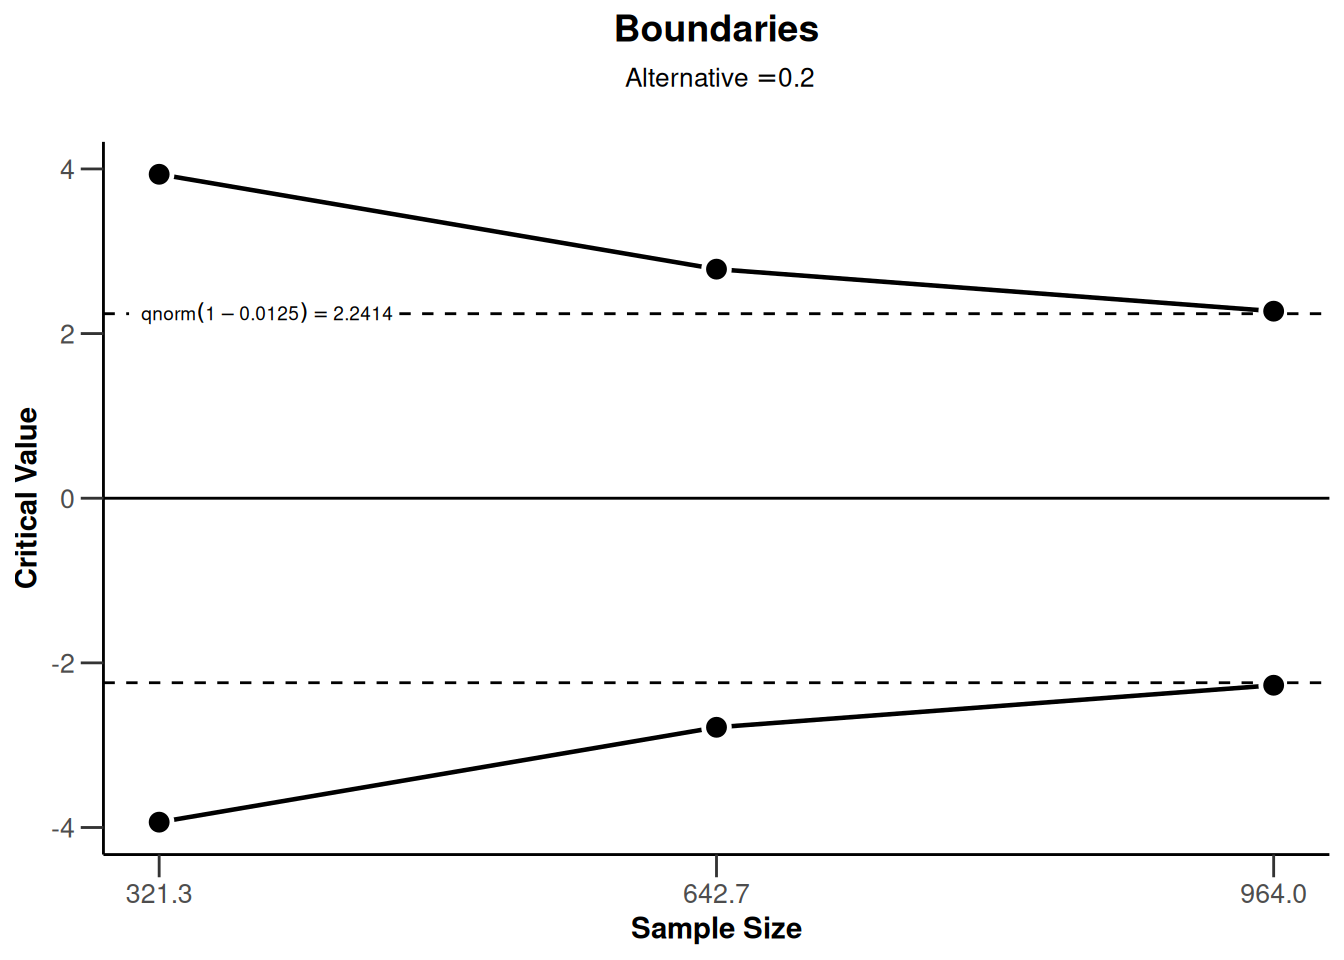
plot(sampleSizeMeans2, type = 2)Warning: Only the first 'alternative' (0.2) was used for plotting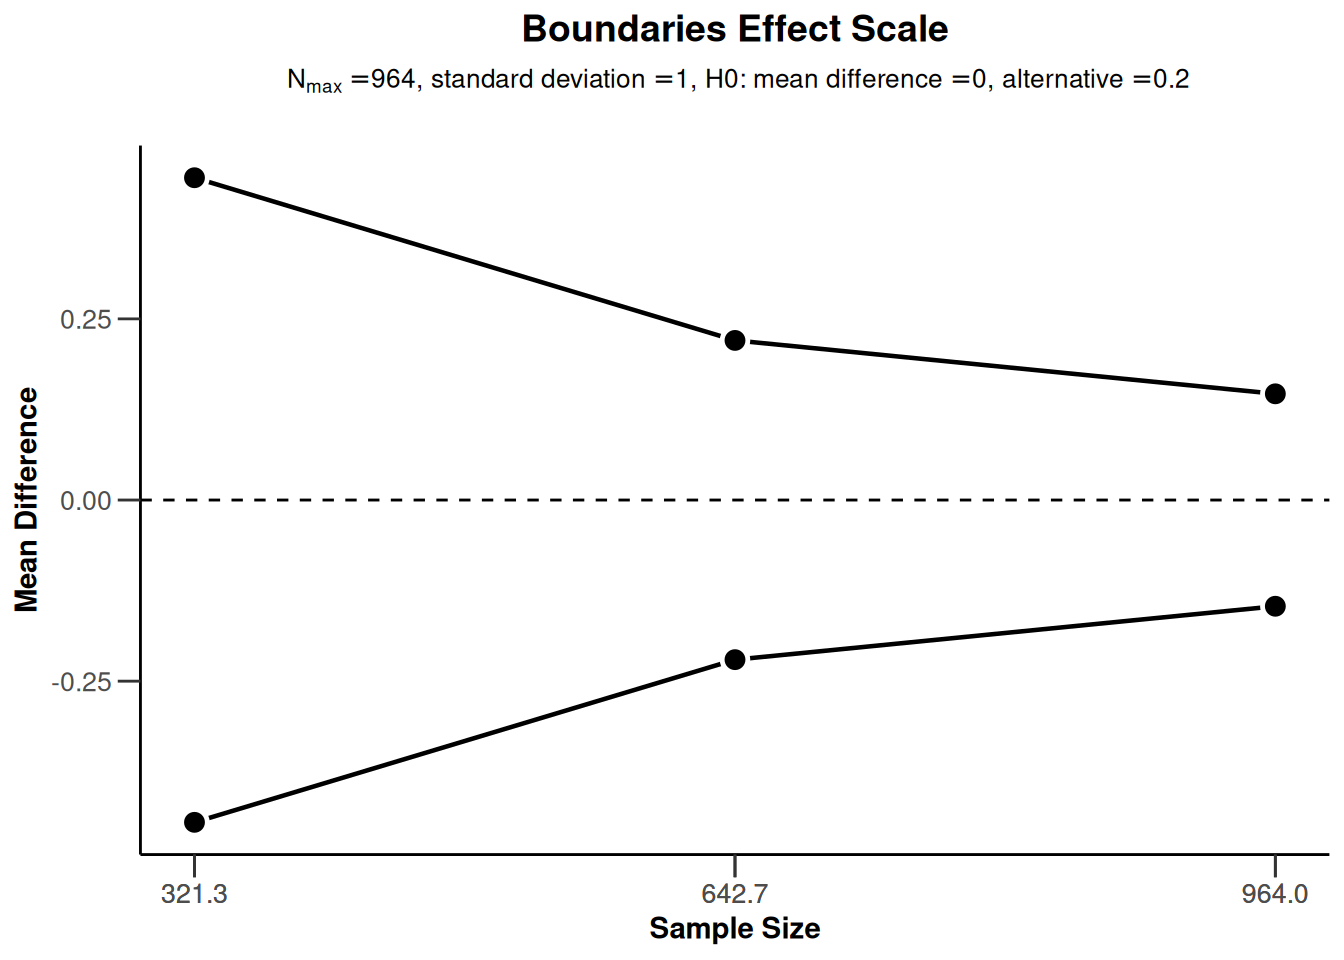
Sample size rates (binary endpoint)
Sample size rates for a one-sided design with futility bounds
sampleSizeRates1 <- getSampleSizeRates(
    getDesignGroupSequential(
        sided = 1,
        futilityBounds = c(0, 0.1)
    )
)

plot(sampleSizeRates1, type = 1)
Warning: Only the first 'pi1' (0.4) was used for plotting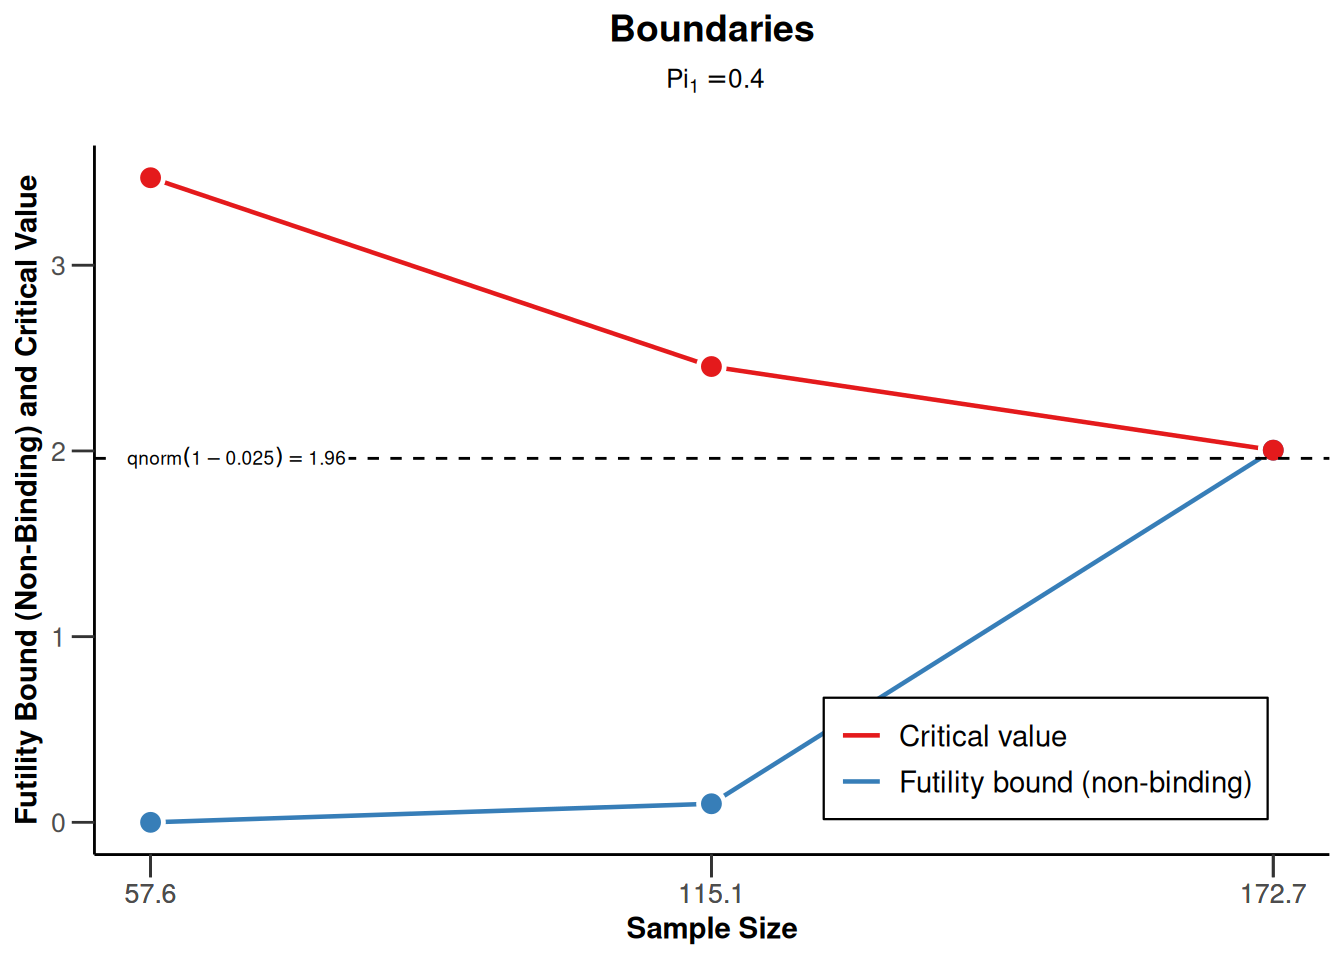
plot(sampleSizeRates1, type = 2)Warning: Only the first 'pi1' (0.4) was used for plotting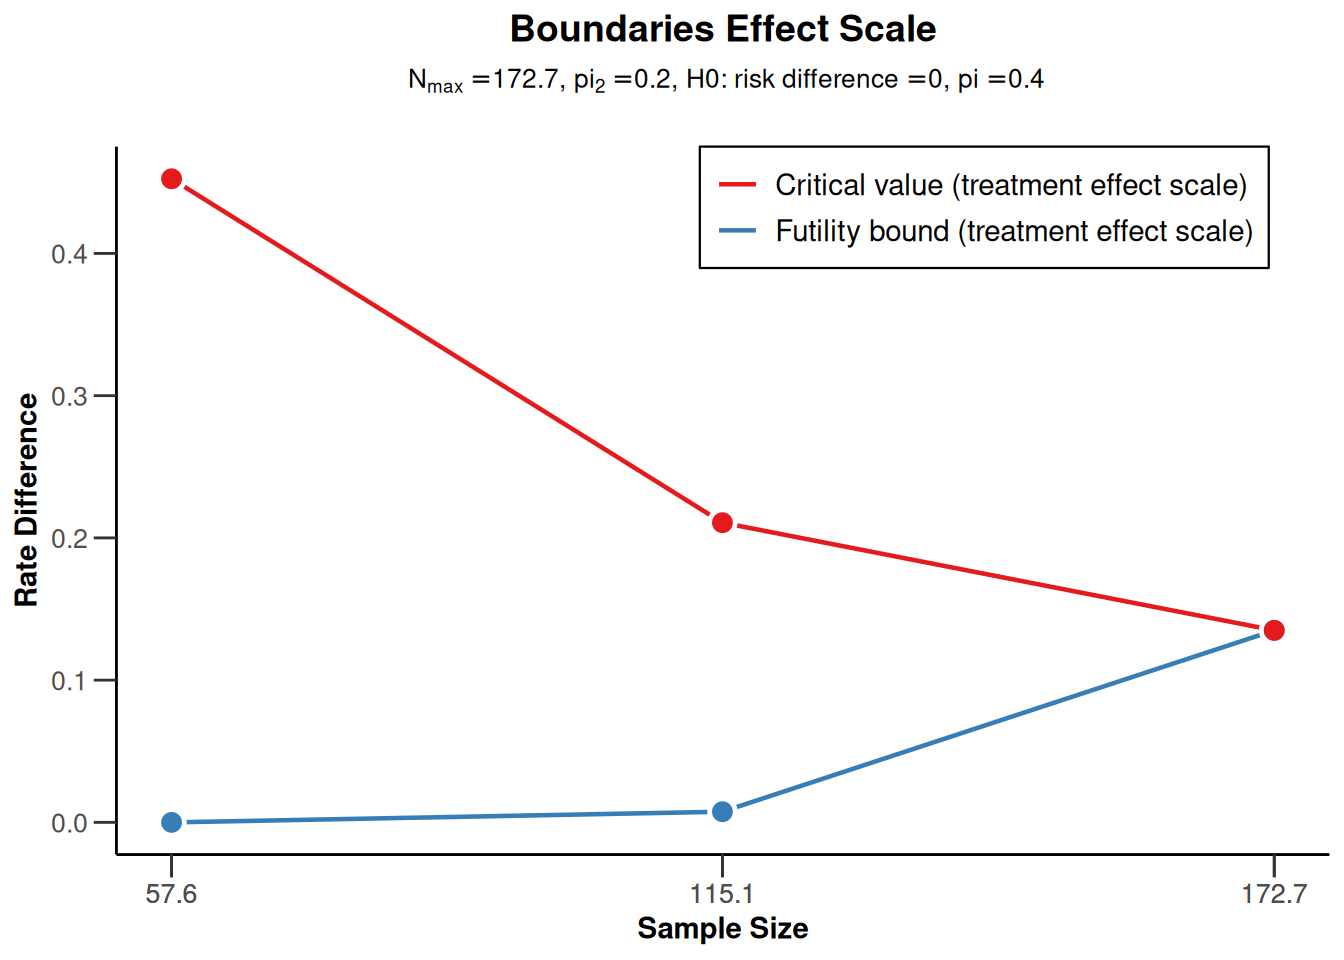
Sample size rates for a two-sided design
sampleSizeRates2 <- getSampleSizeRates(
    getDesignGroupSequential(sided = 2)
)

plot(sampleSizeRates2, type = 1)
Warning: Only the first 'pi1' (0.4) was used for plotting
plot(sampleSizeRates2, type = 2)Warning: Only the first 'pi1' (0.4) was used for plotting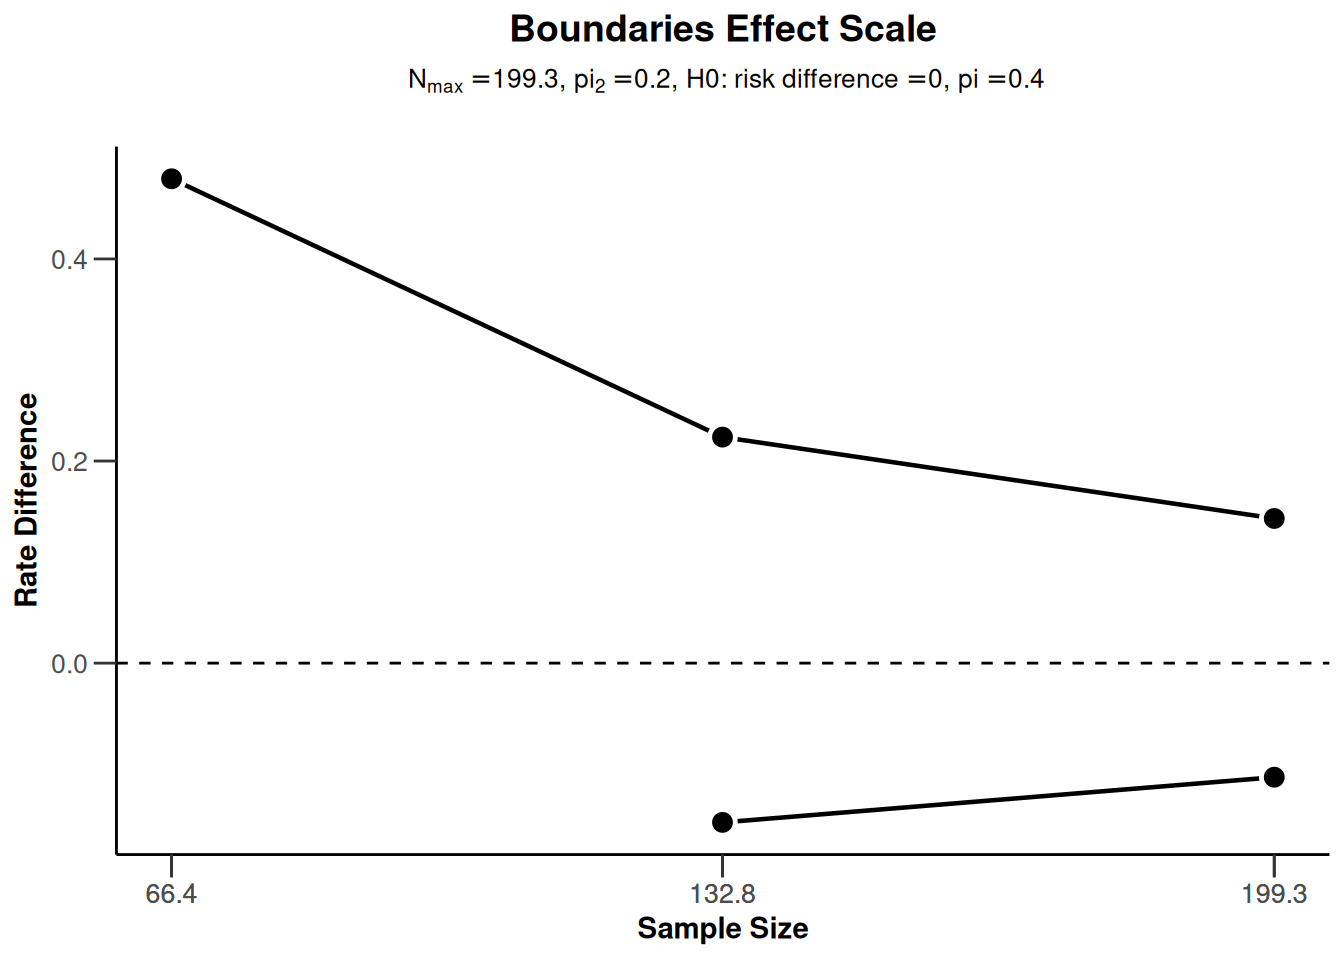
Sample size survival (survival endpoint)
Sample size survival for a one-sided design with futility bounds
design <- getDesignGroupSequential(
    kMax = 3, typeOfDesign = "OF", sided = 1,
    futilityBounds = c(-1, 0.5)
)

piecewiseSurvivalTime <- list(
    "0 - <6" = 0.025,
    "6 - <9" = 0.04,
    "9 - <15" = 0.015,
    "15 - <21" = 0.01,
    ">= 21" = 0.007
)

sampleSizeSurvival1 <- getSampleSizeSurvival(
    design = design,
    typeOfComputation = "Schoenfeld",
    thetaH0 = 1, allocationRatioPlanned = 1, kappa = 1,
    piecewiseSurvivalTime = piecewiseSurvivalTime,
    hazardRatio = c(0.5, 0.9)
)

plot(sampleSizeSurvival1, type = 1)
Warning: Only the first 'hazardRatio' (0.5) was used for plotting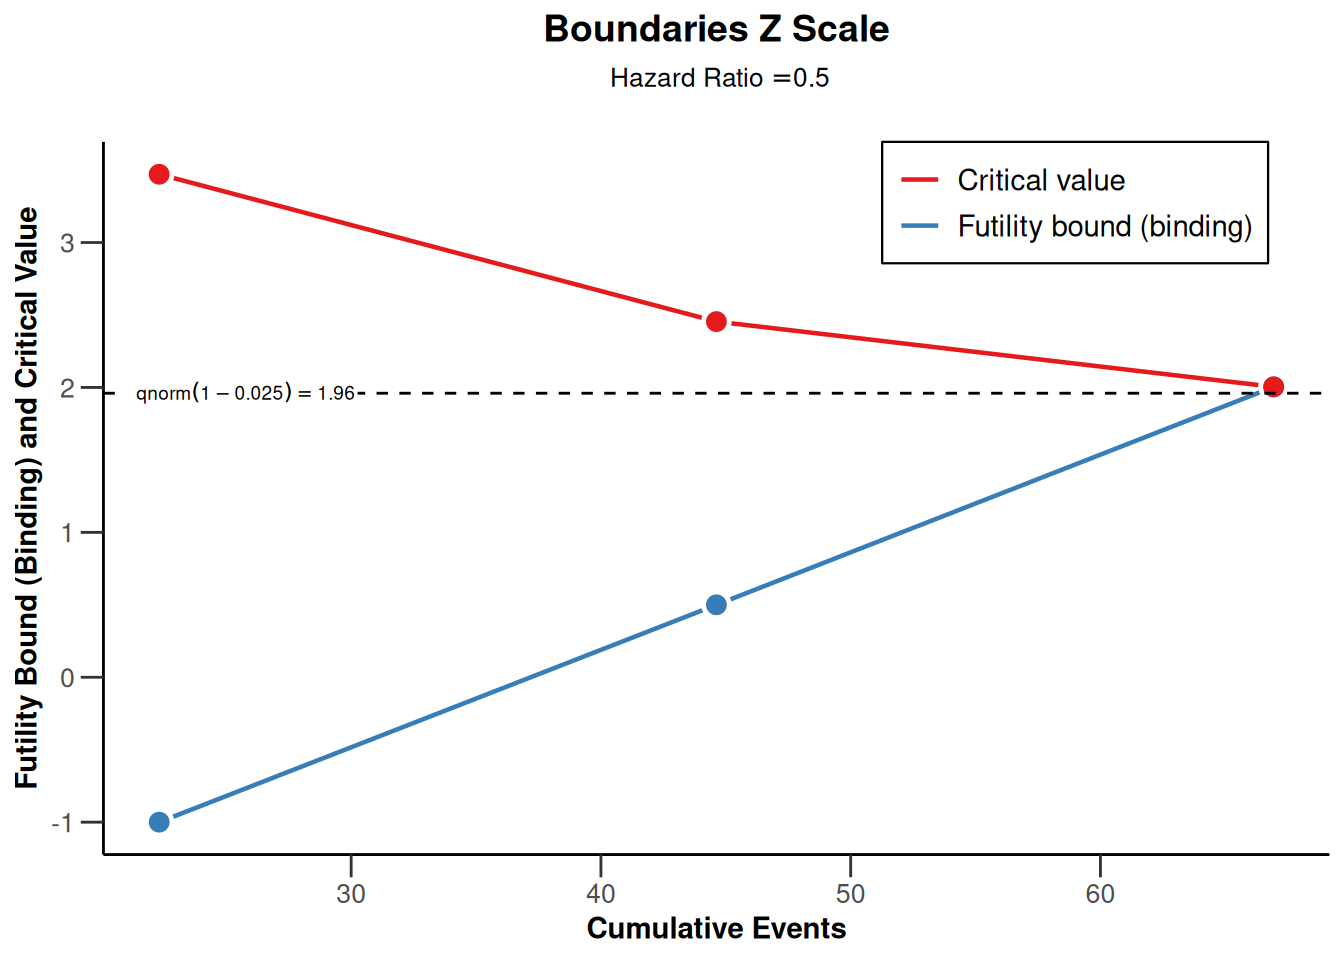
plot(sampleSizeSurvival1, type = 2)Warning: Only the first 'hazardRatio' (0.5) was used for plotting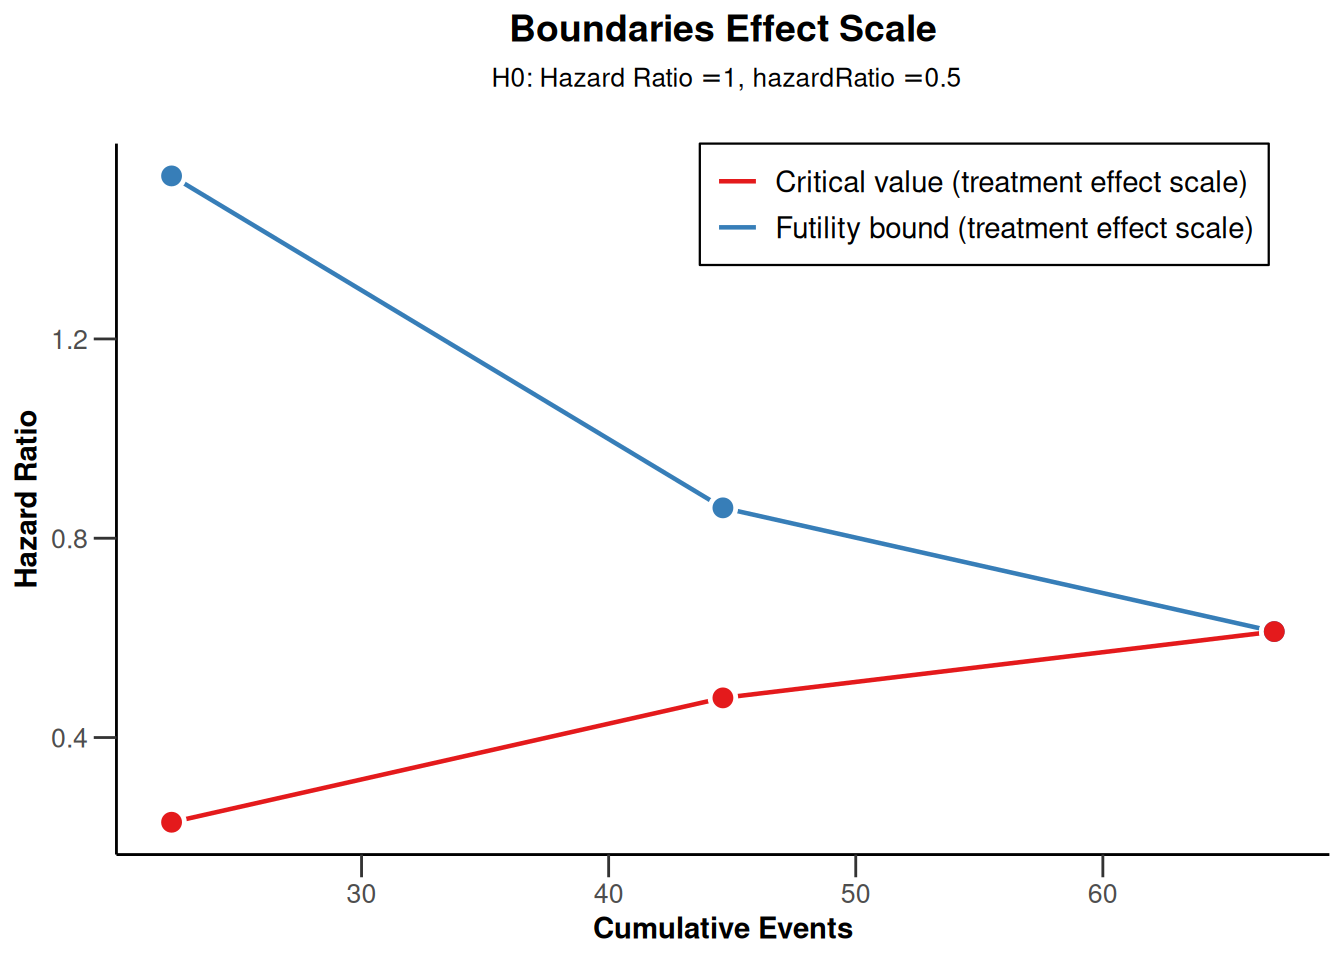
plot(sampleSizeSurvival1, type = 13, legendPosition = 1)Warning: Only the first 'hazardRatio' (0.5) was used for plotting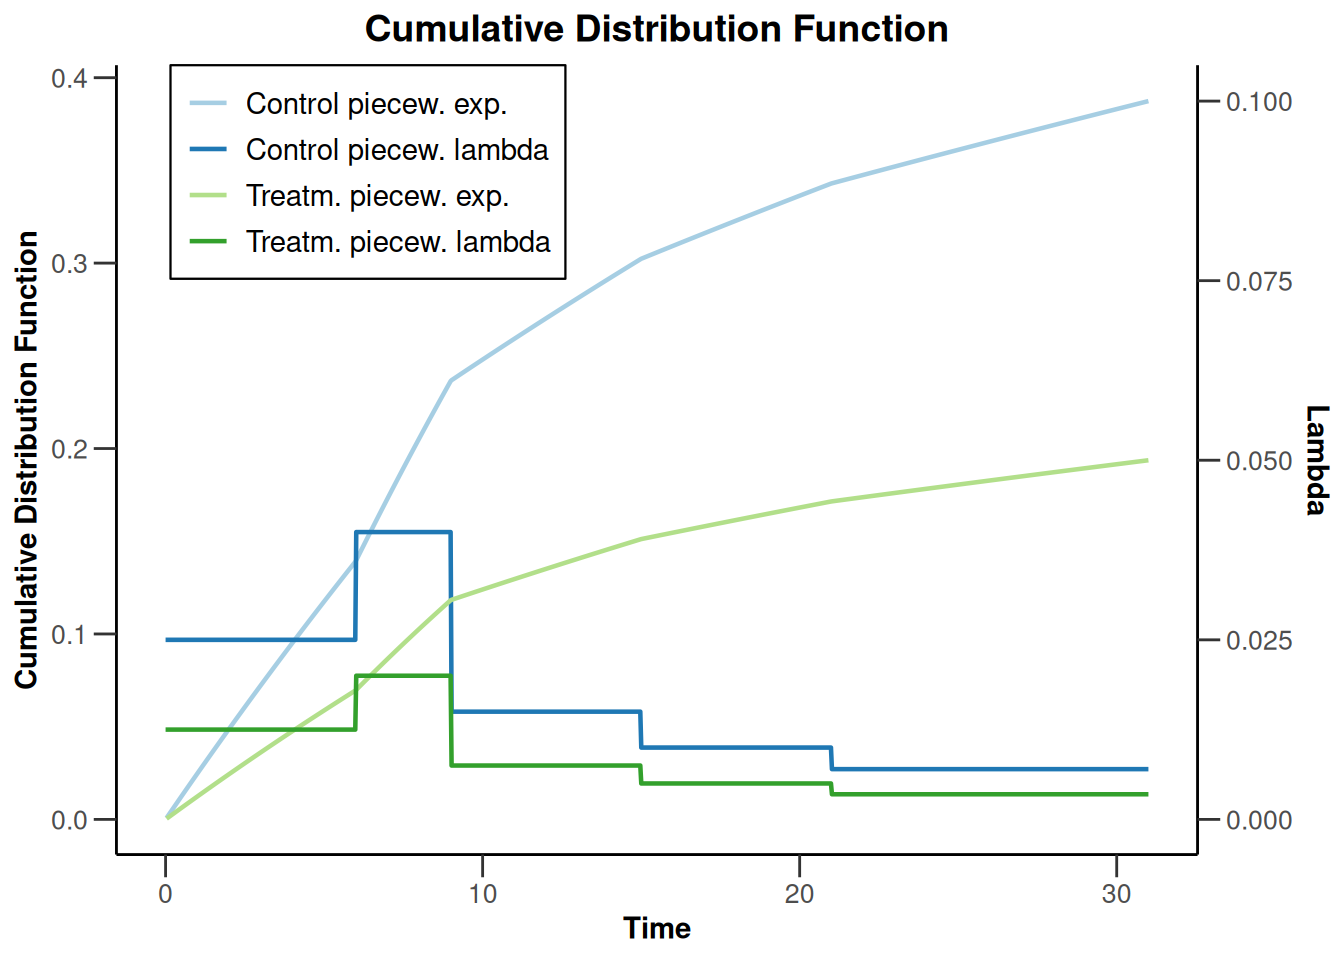
plot(sampleSizeSurvival1, type = 14)Warning: Only the first 'hazardRatio' (0.5) was used for plotting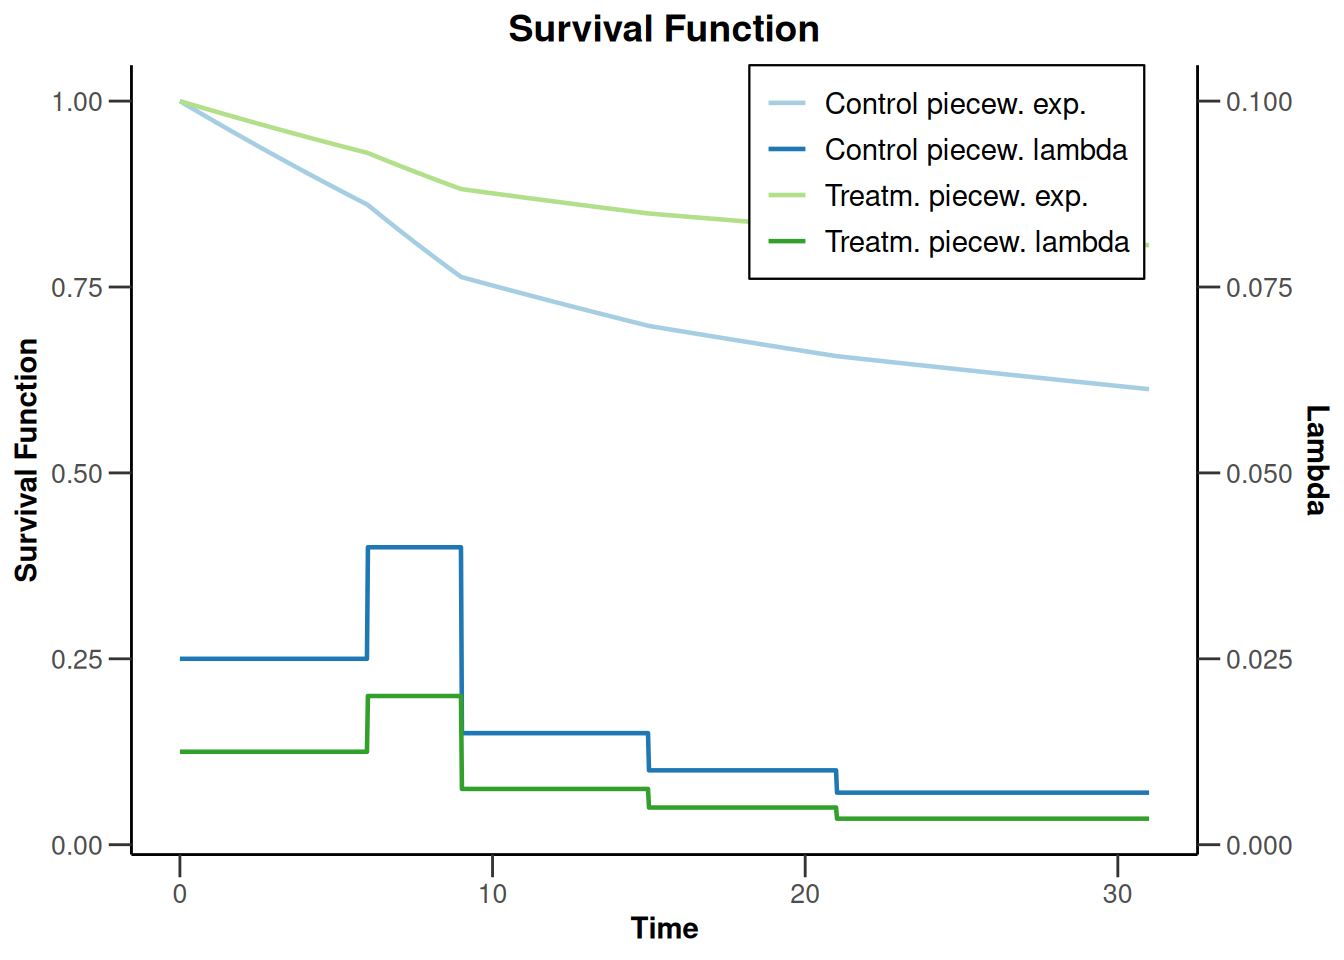
Sample size survival for a two-sided design
design <- getDesignGroupSequential(
    kMax = 3, typeOfDesign = "OF",
    sided = 2, twoSidedPower = TRUE
)

piecewiseSurvivalTime <- list(
    "0  - <14" = 0.015,
    "14 - <24" = 0.01,
    "24 - <44" = 0.005,
    ">= 44" = 0.0025
)
sampleSizeSurvival2 <- getSampleSizeSurvival(
    design = design,
    typeOfComputation = "Schoenfeld",
    thetaH0 = 1,
    allocationRatioPlanned = 1, kappa = 1,
    piecewiseSurvivalTime = piecewiseSurvivalTime,
    maxNumberOfSubjects = 0, hazardRatio = c(0.1, 0.2, 0.5, 0.6)
)

plot(sampleSizeSurvival2, type = 1)
Warning: Only the first 'hazardRatio' (0.1) was used for plotting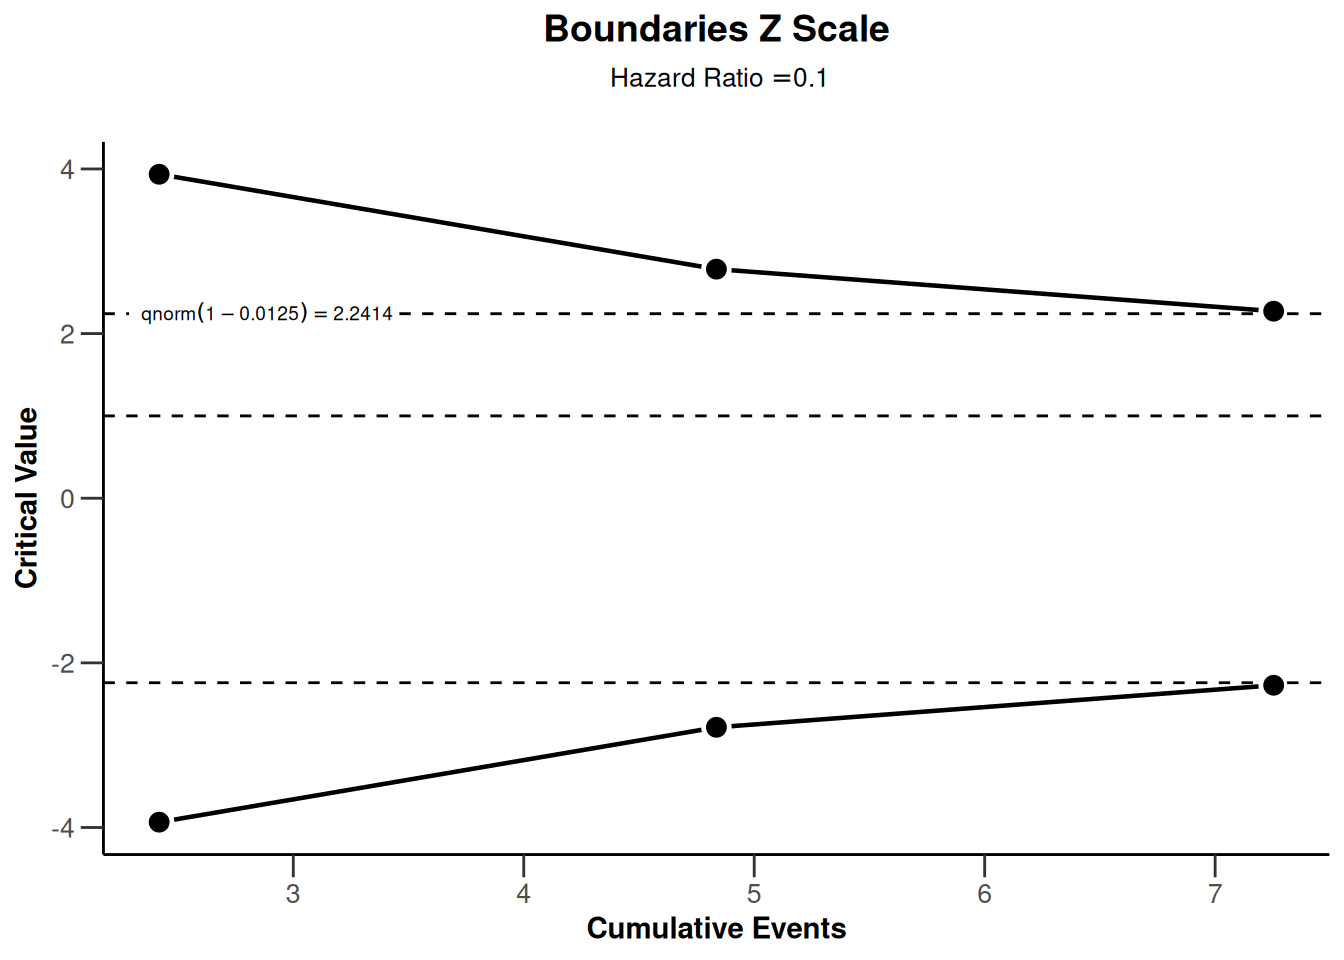
plot(sampleSizeSurvival2, type = 2)Warning: Only the first 'hazardRatio' (0.1) was used for plotting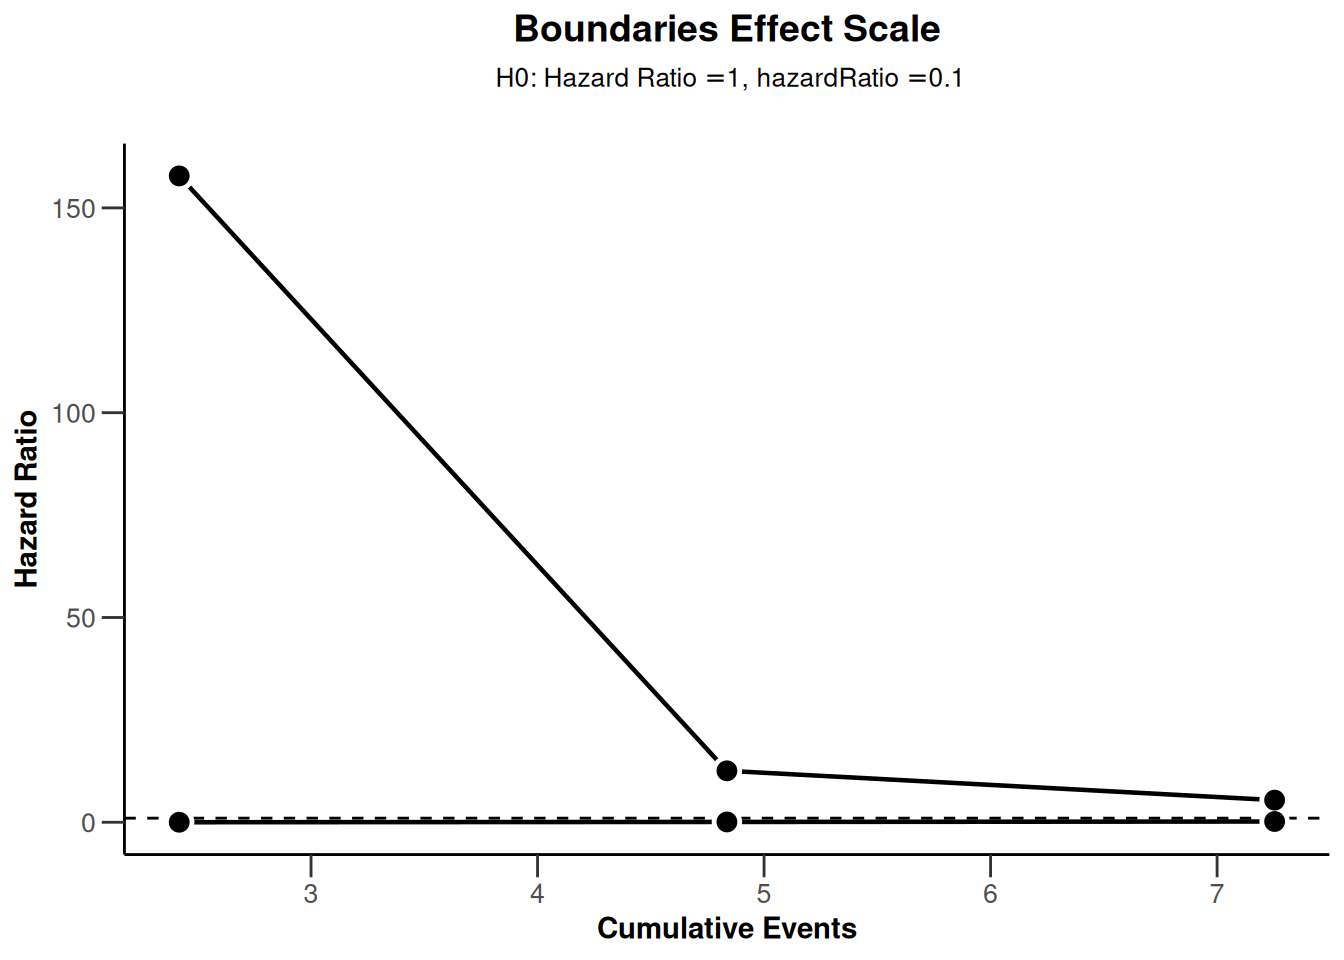
plot(sampleSizeSurvival2, type = 13, legendPosition = 1)Warning: Only the first 'hazardRatio' (0.1) was used for plotting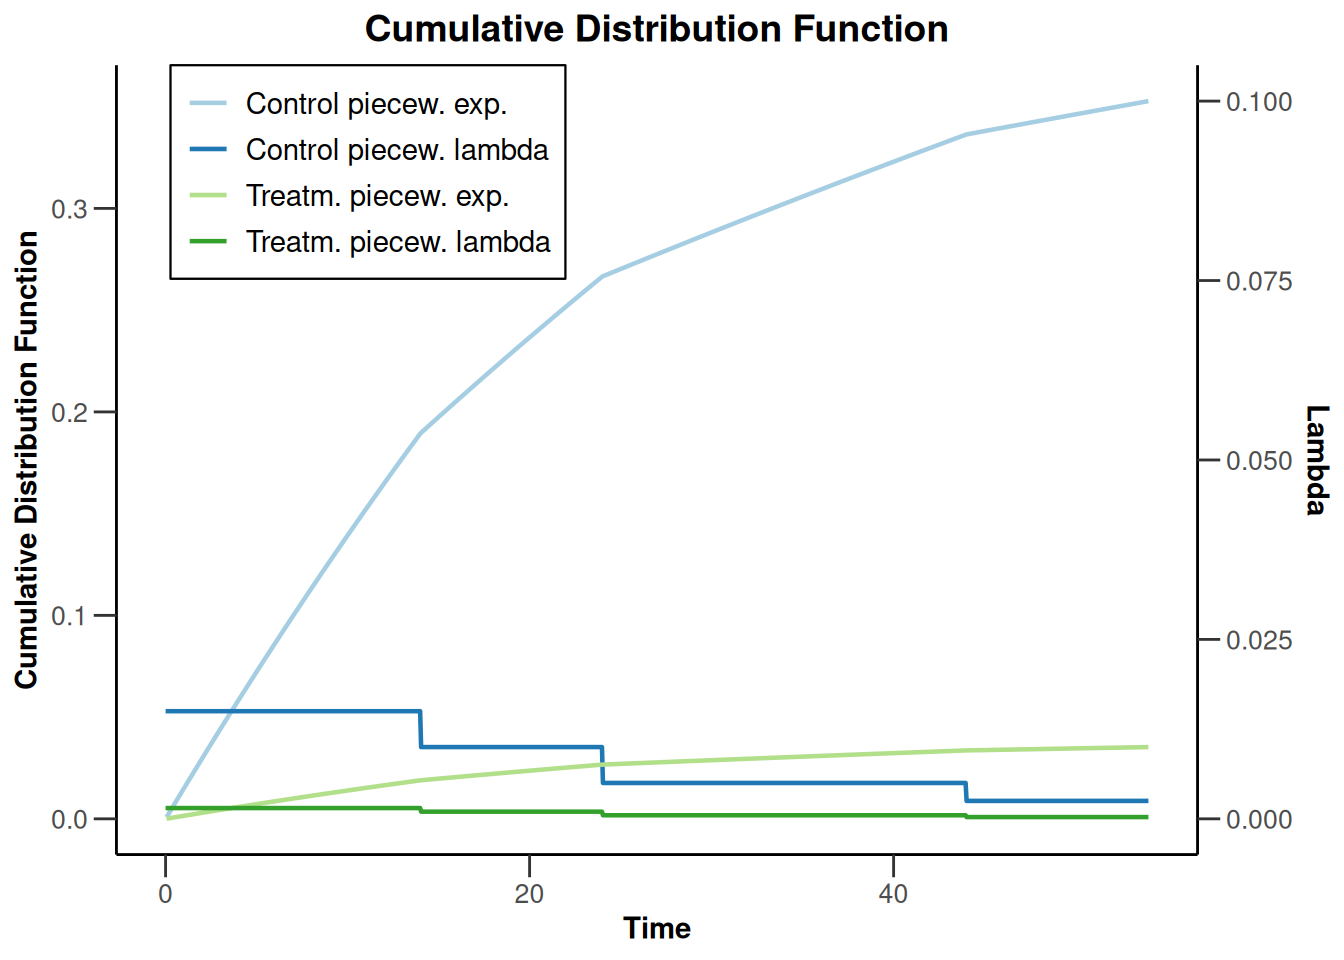
plot(sampleSizeSurvival2, type = 14)Warning: Only the first 'hazardRatio' (0.1) was used for plotting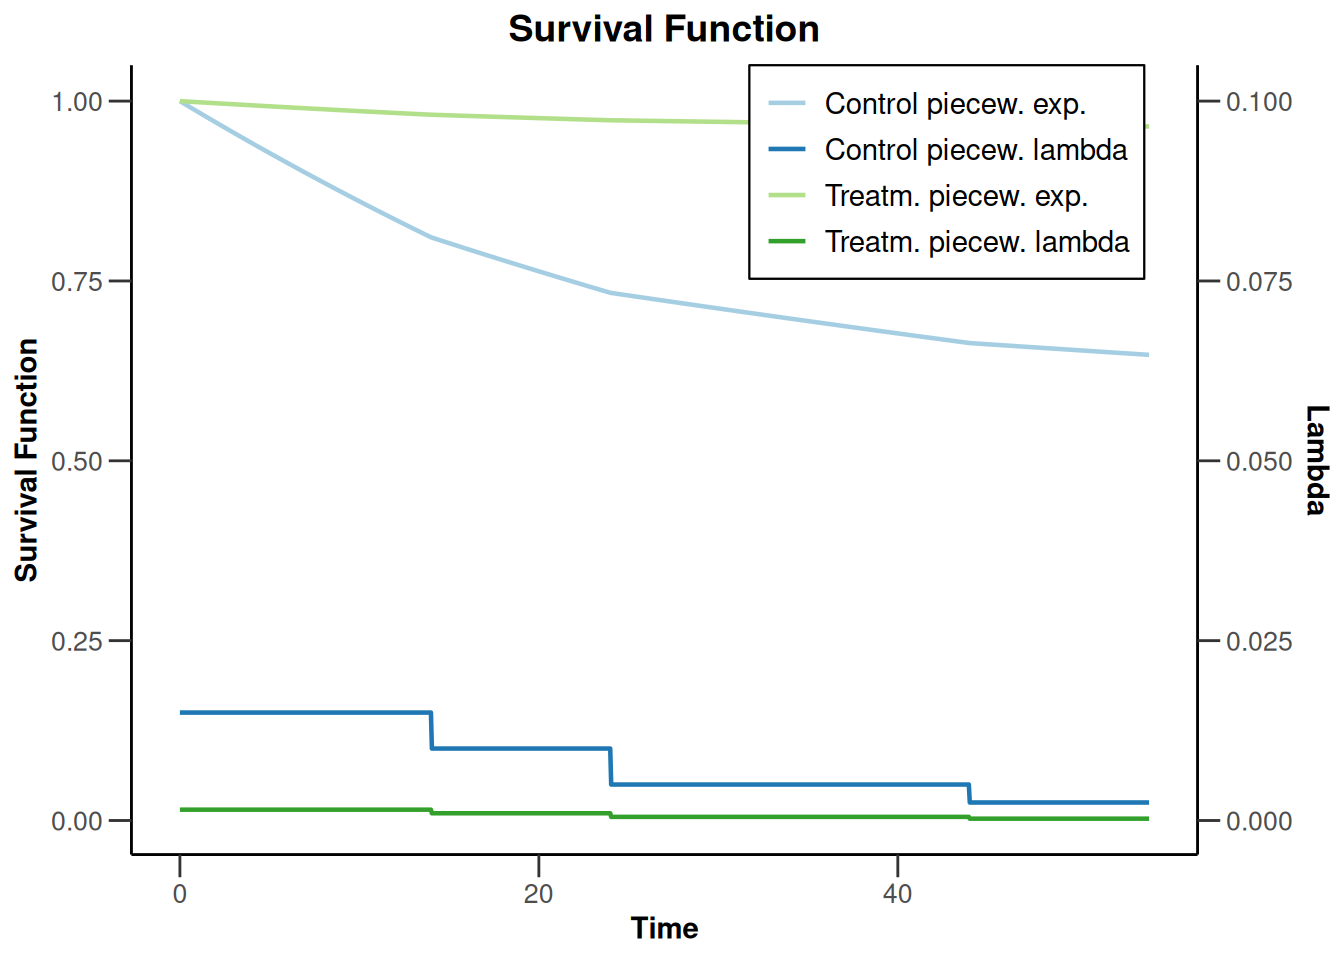
Power plots
Power means (continuous endpoint)
Power means for a one-sided design with futility bounds
design <- getDesignGroupSequential(
    typeOfDesign = "OF", sided = 1,
    futilityBounds = c(0, 0.5)
)

powerMeans1 <- getPowerMeans(design,
    groups = 1, meanRatio = FALSE,
    thetaH0 = 0, alternative = c(-1, 4),
    stDev = 2, normalApproximation = FALSE,
    maxNumberOfSubjects = 40
)

plot(powerMeans1, type = 1)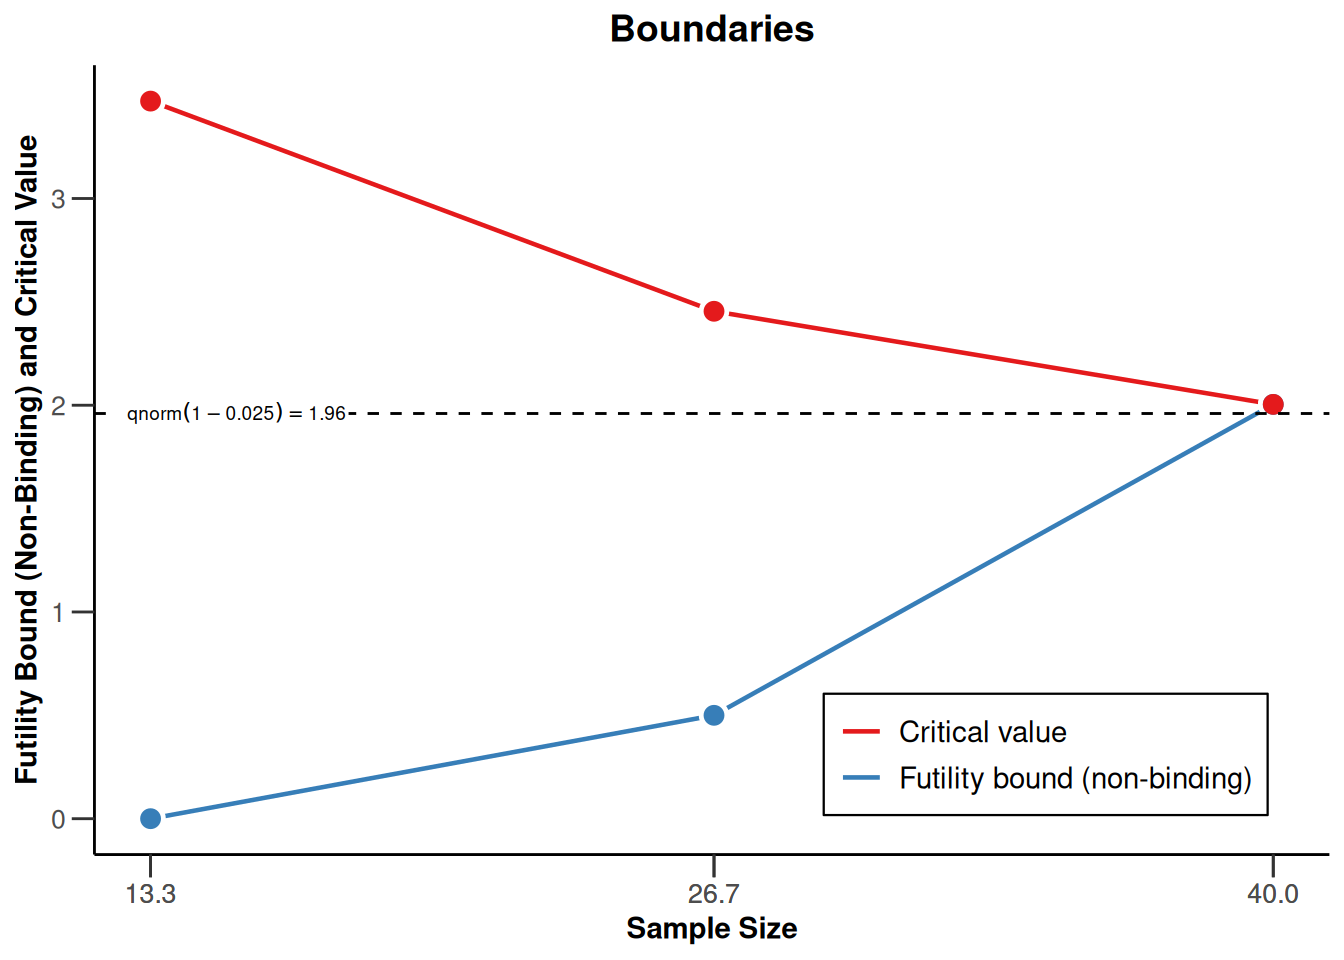
plot(powerMeans1, type = 2)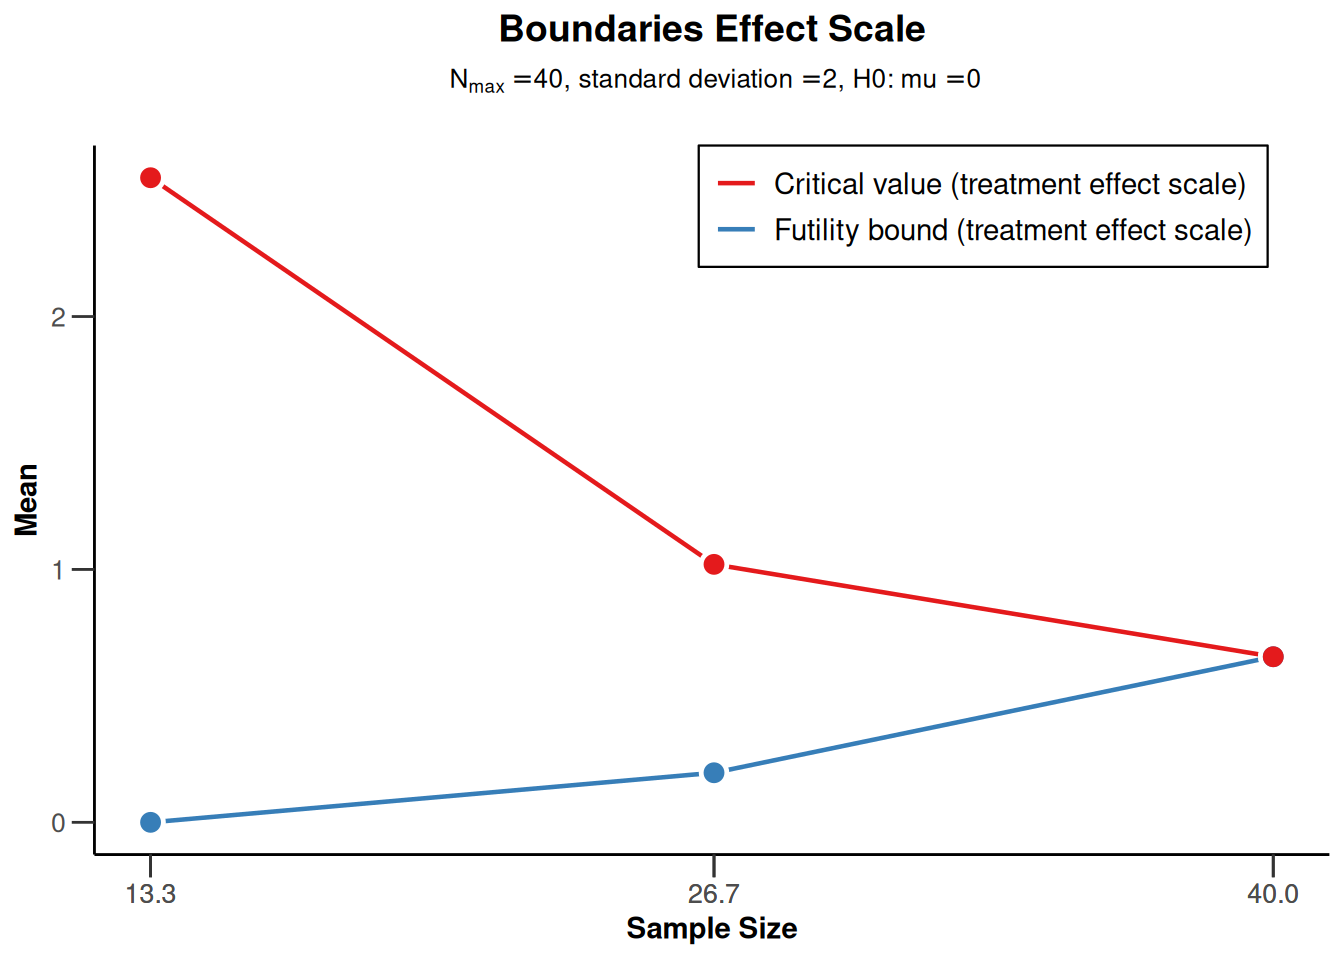
plot(powerMeans1, type = 5)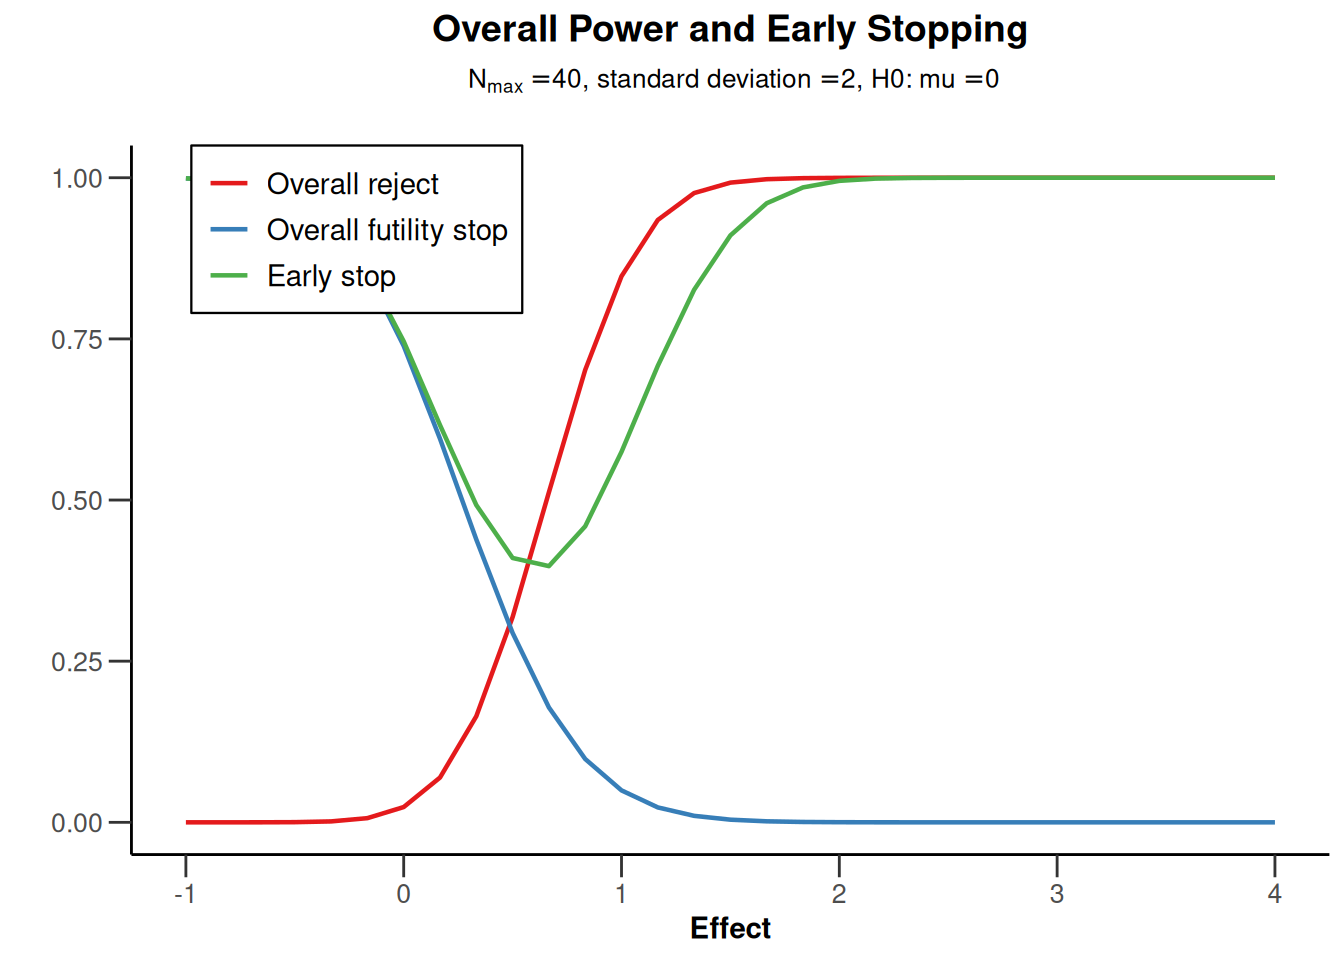
plot(powerMeans1, type = 6)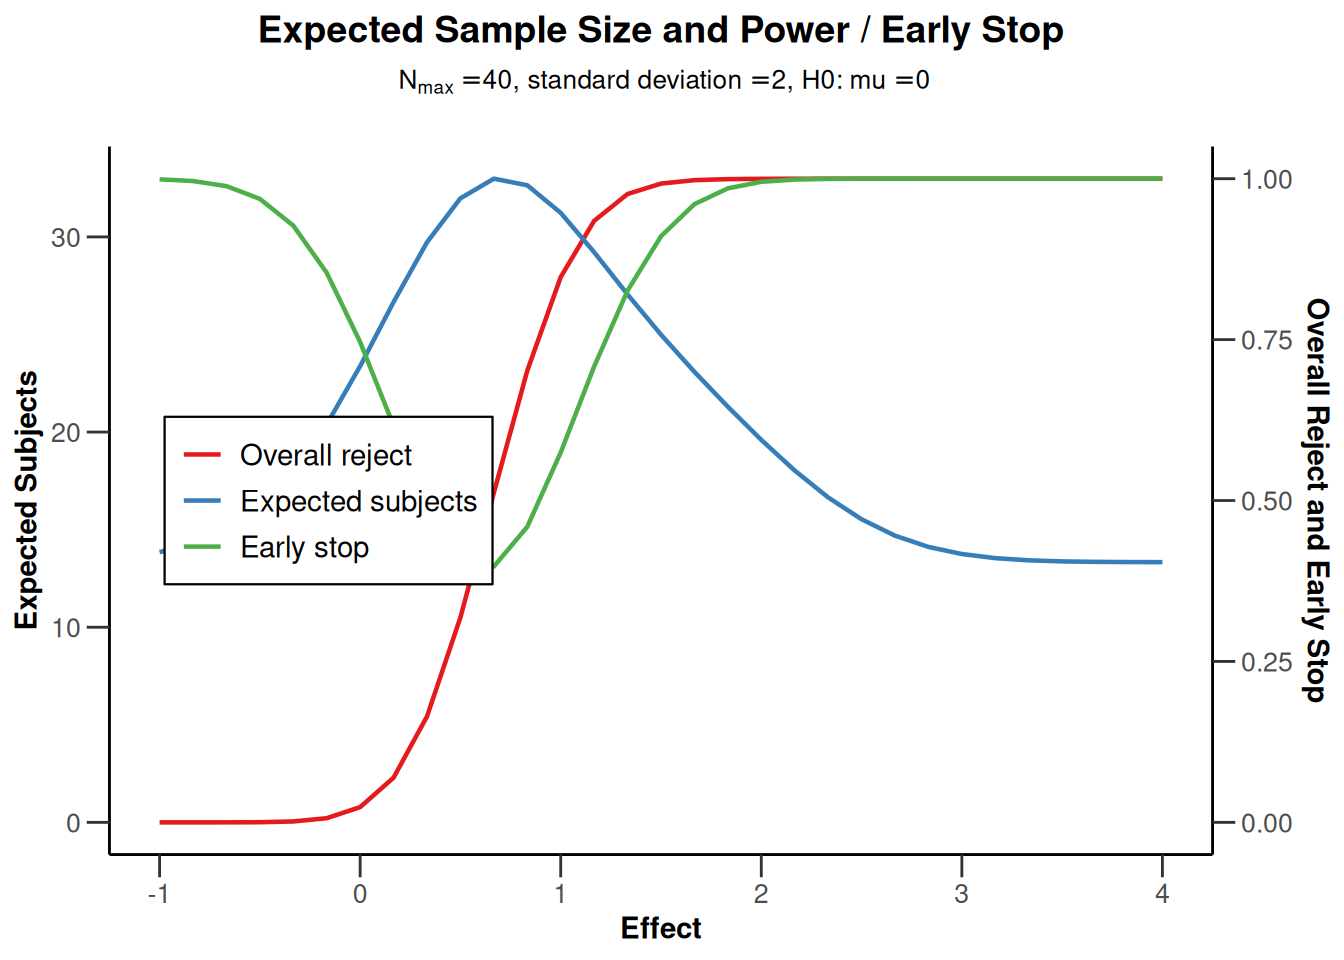
Power means for a two-sided design
powerMeans2 <- getPowerMeans(
    getDesignGroupSequential(
        typeOfDesign = "OF", sided = 2, twoSidedPower = TRUE
    ),
    maxNumberOfSubjects = 30
)

plot(powerMeans2, type = 1)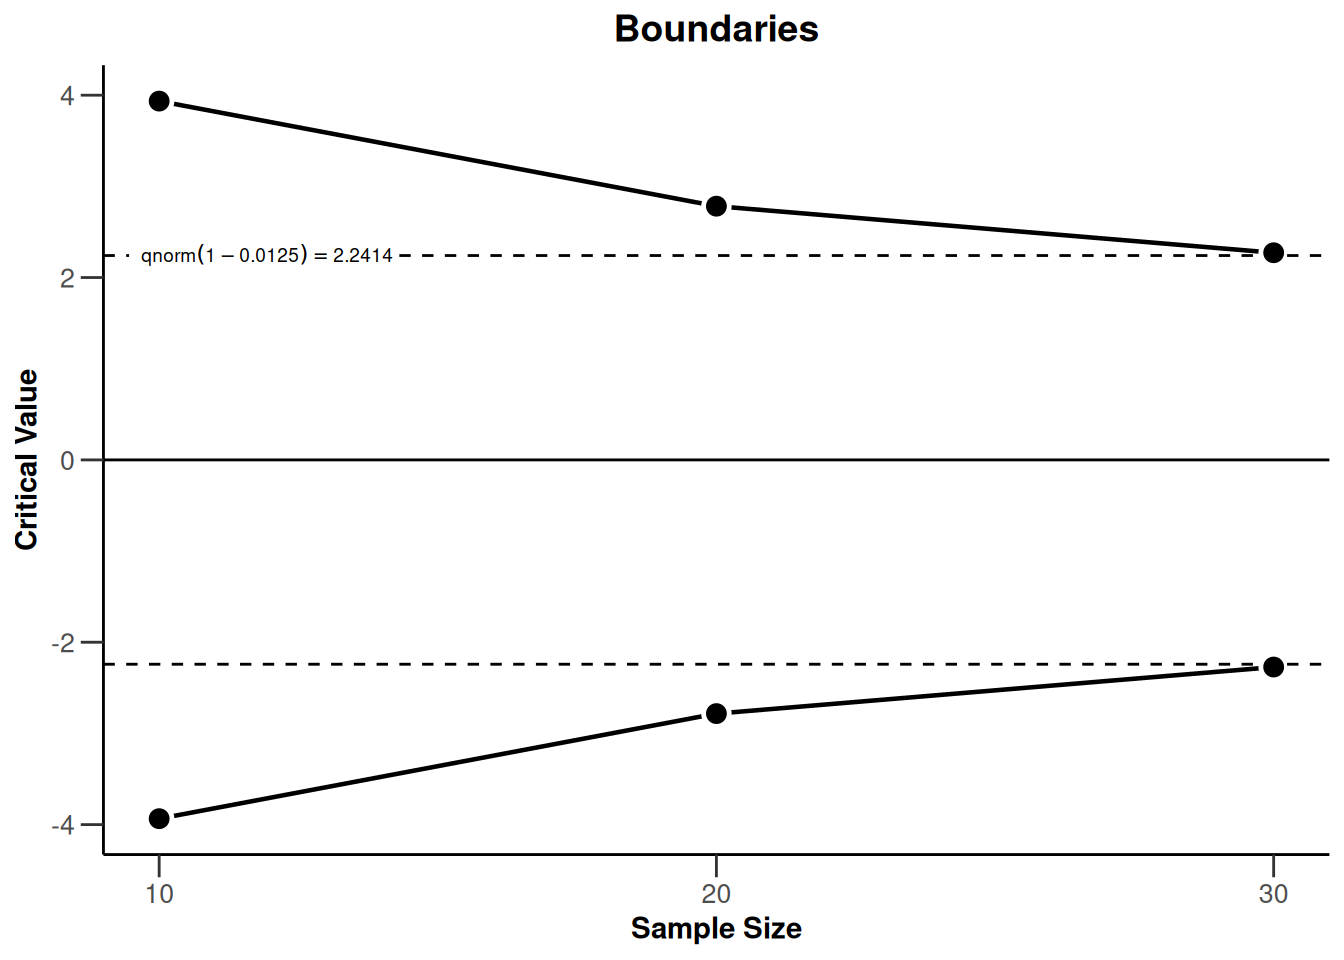
plot(powerMeans2, type = 2)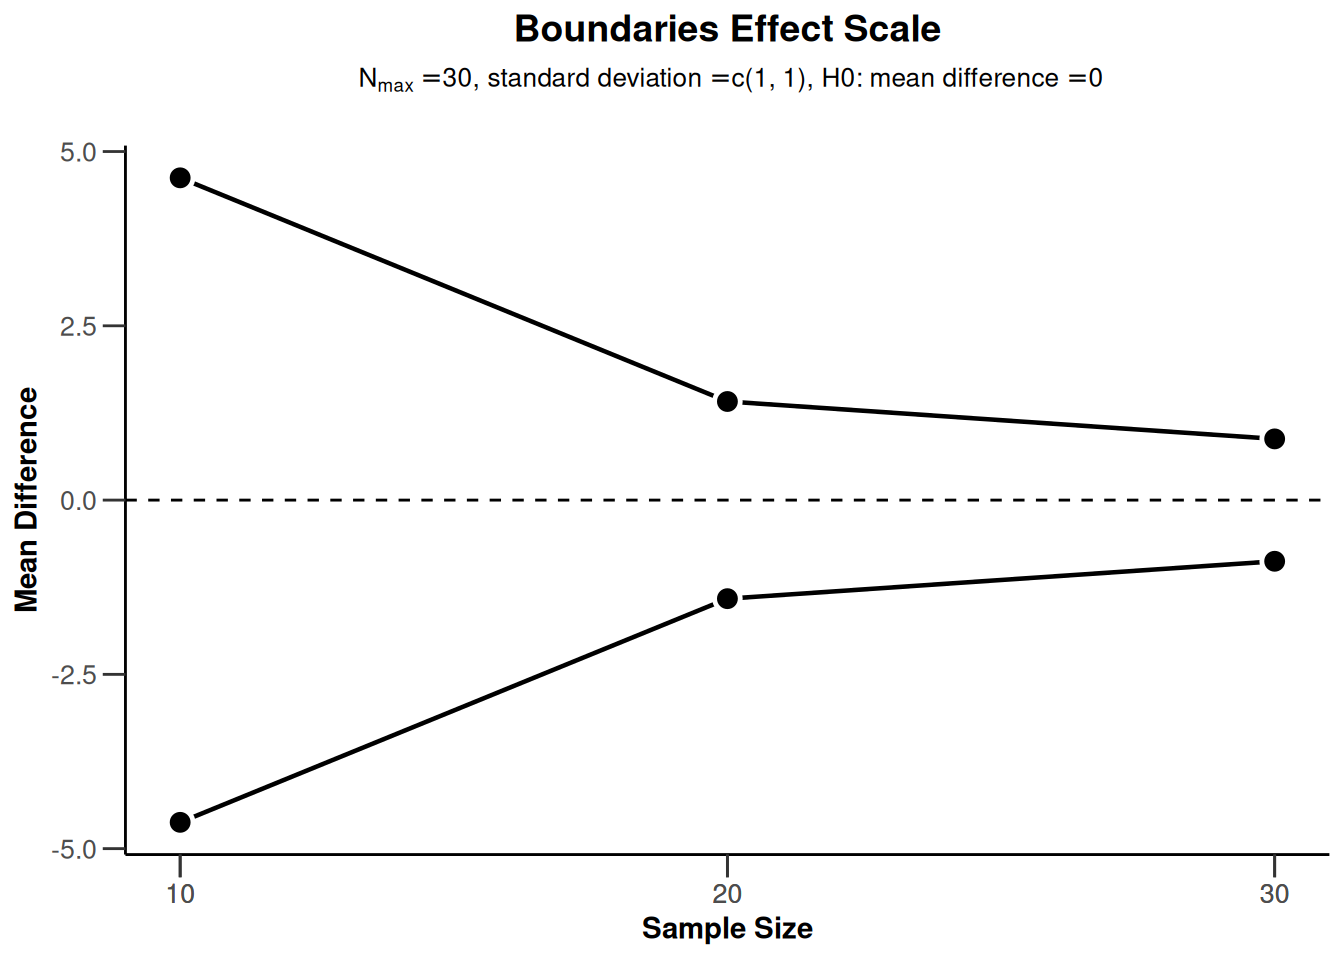
plot(powerMeans2, type = 5)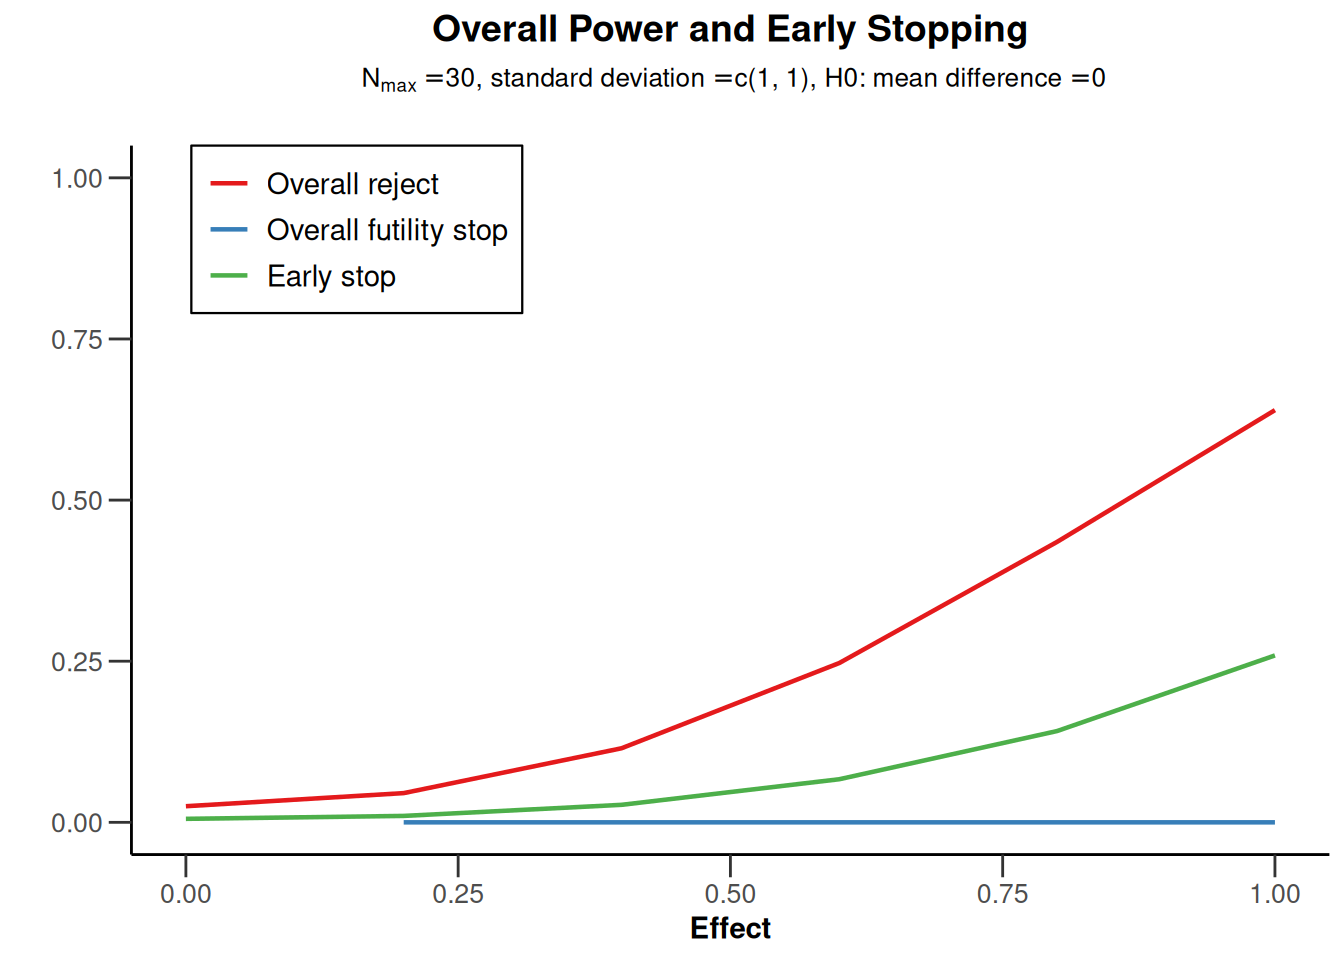
plot(powerMeans2, type = 6)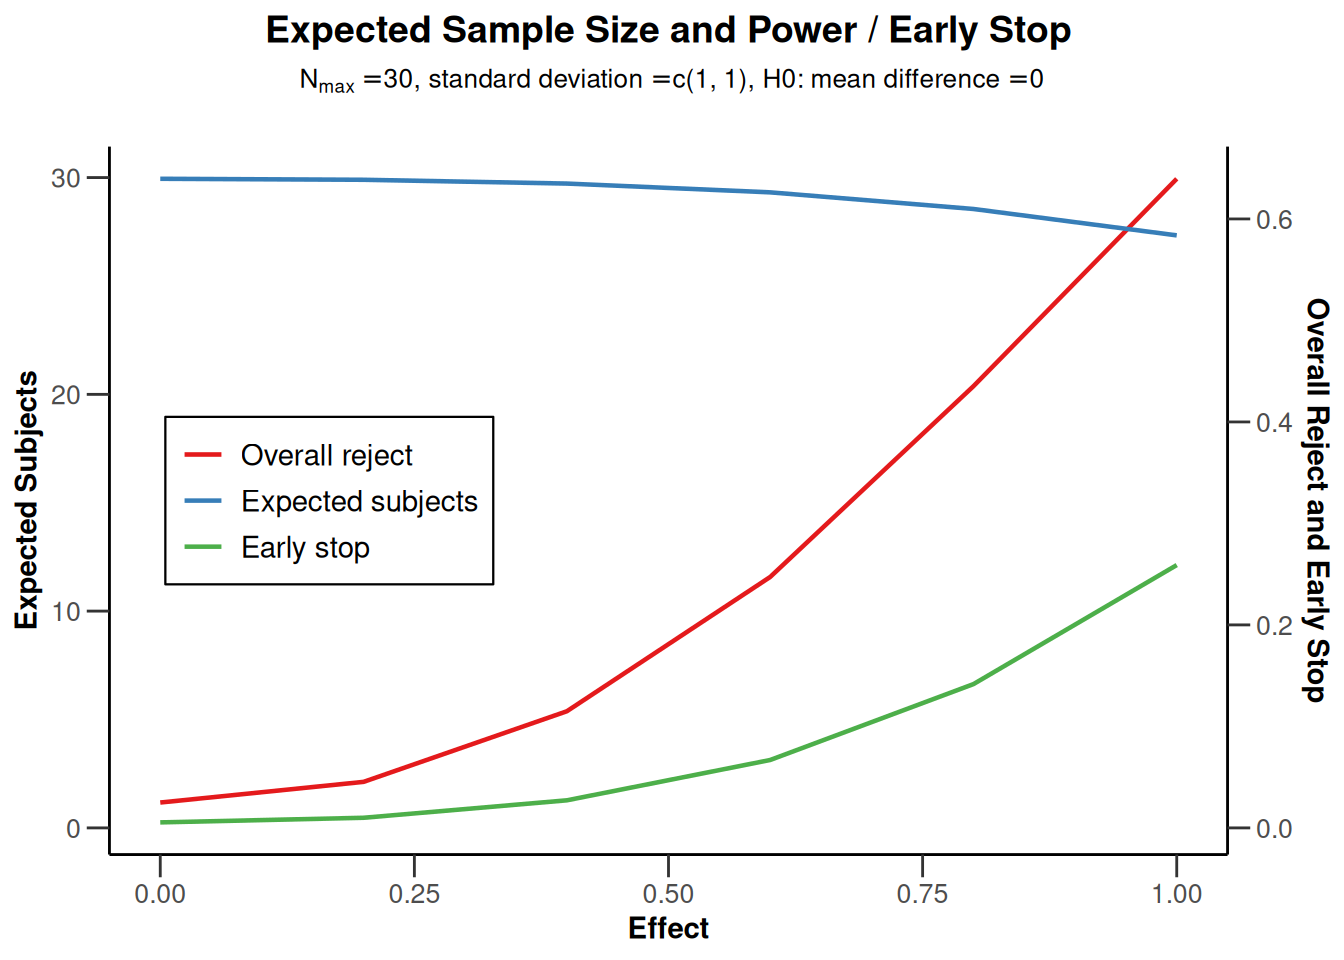
Power rates (binary endpoint)
Power rates for a one-sided design with futility bounds
design <- getDesignGroupSequential(
    kMax = 3,
    typeOfDesign = "OF",
    sided = 1,
    futilityBounds = c(-1, 0.5)
)

powerRates1 <- getPowerRates(design,
    groups = 2, riskRatio = TRUE,
    thetaH0 = 0.2, allocationRatioPlanned = 1,
    pi1 = c(0.1, 0.4), pi2 = 0.2,
    maxNumberOfSubjects = 80
)

plot(powerRates1, type = 1)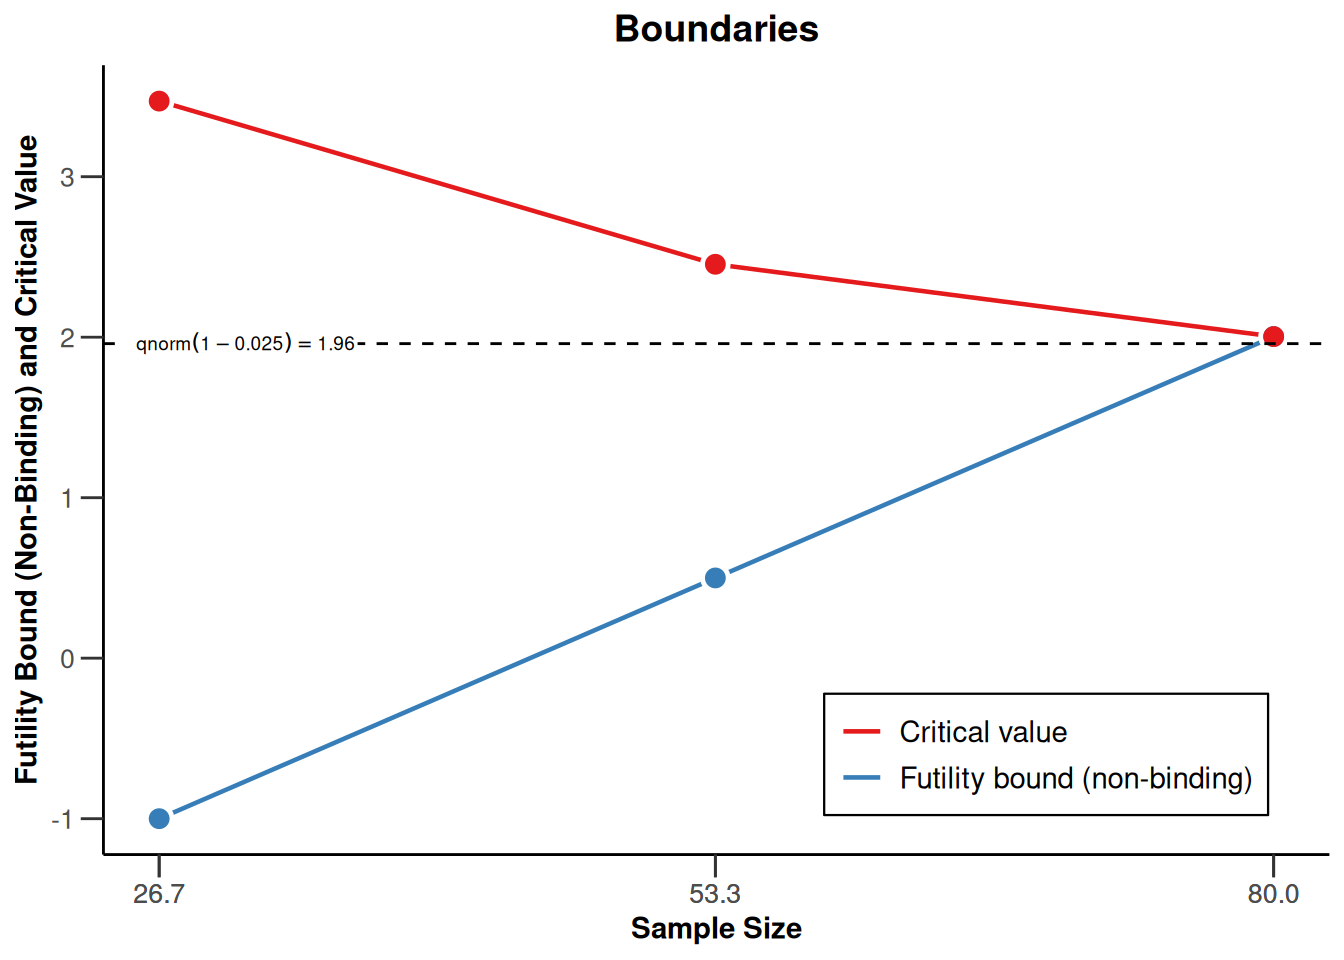
plot(powerRates1, type = 2)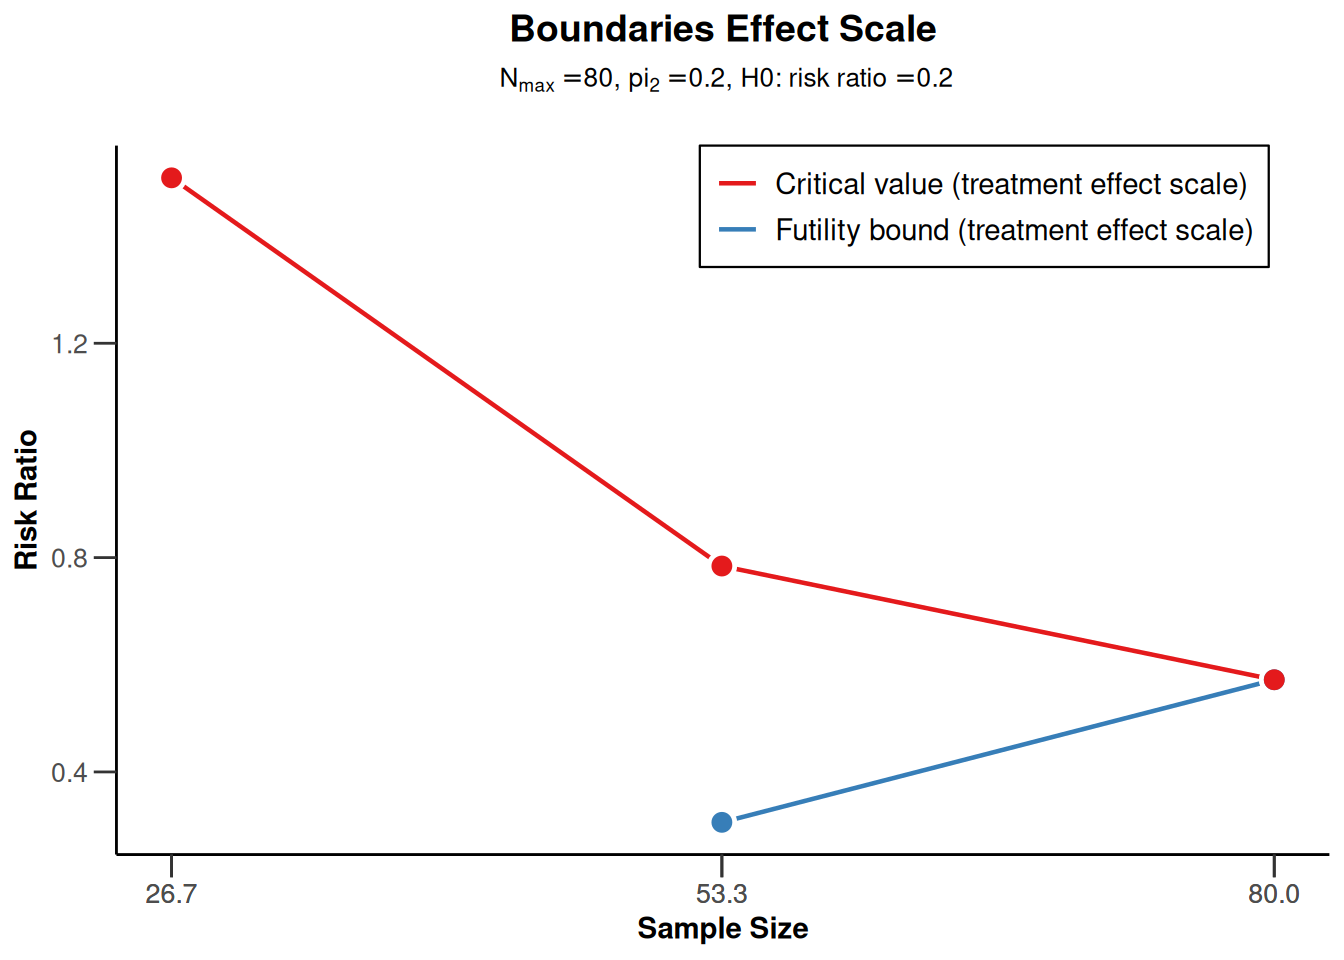
plot(powerRates1, type = 5)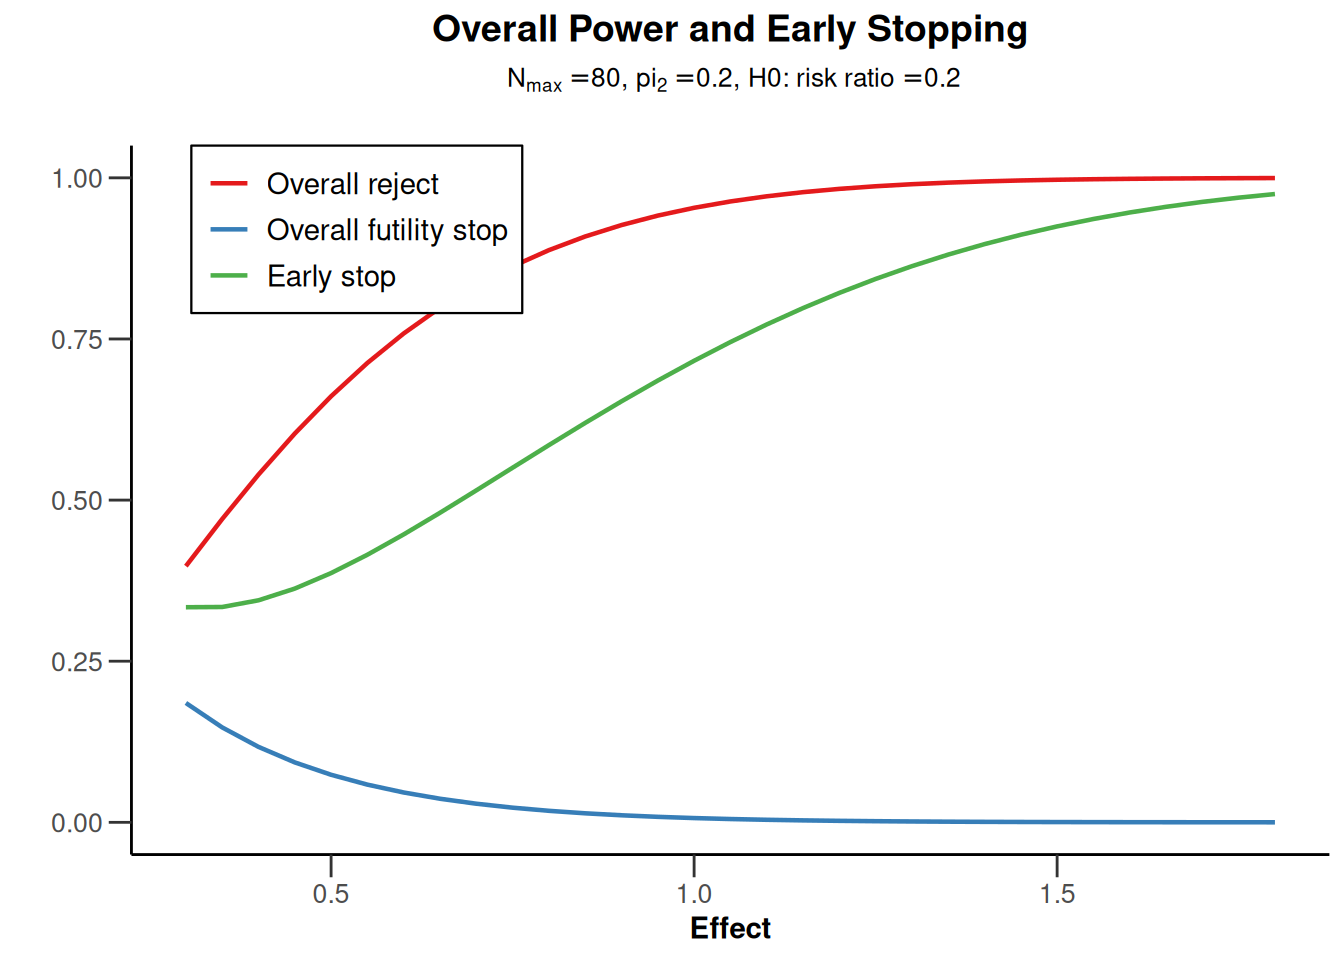
plot(powerRates1, type = 6)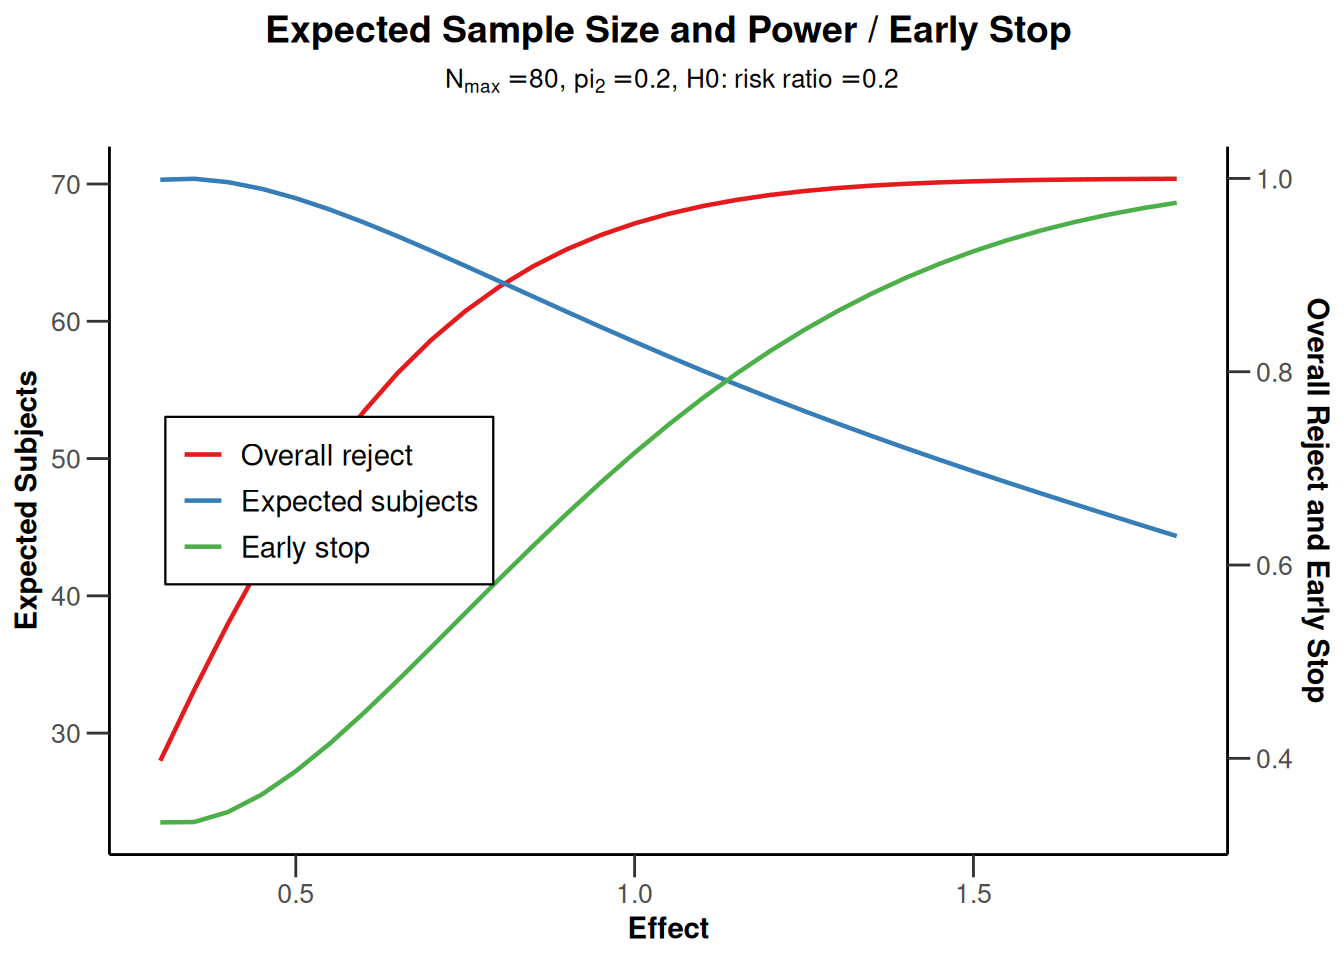
Power rates for a two-sided design
powerRates2 <- getPowerRates(
    getDesignGroupSequential(
        typeOfDesign = "OF", sided = 2, twoSidedPower = TRUE
    ),
    maxNumberOfSubjects = 120
)

plot(powerRates2, type = 1)
plot(powerRates2, type = 2)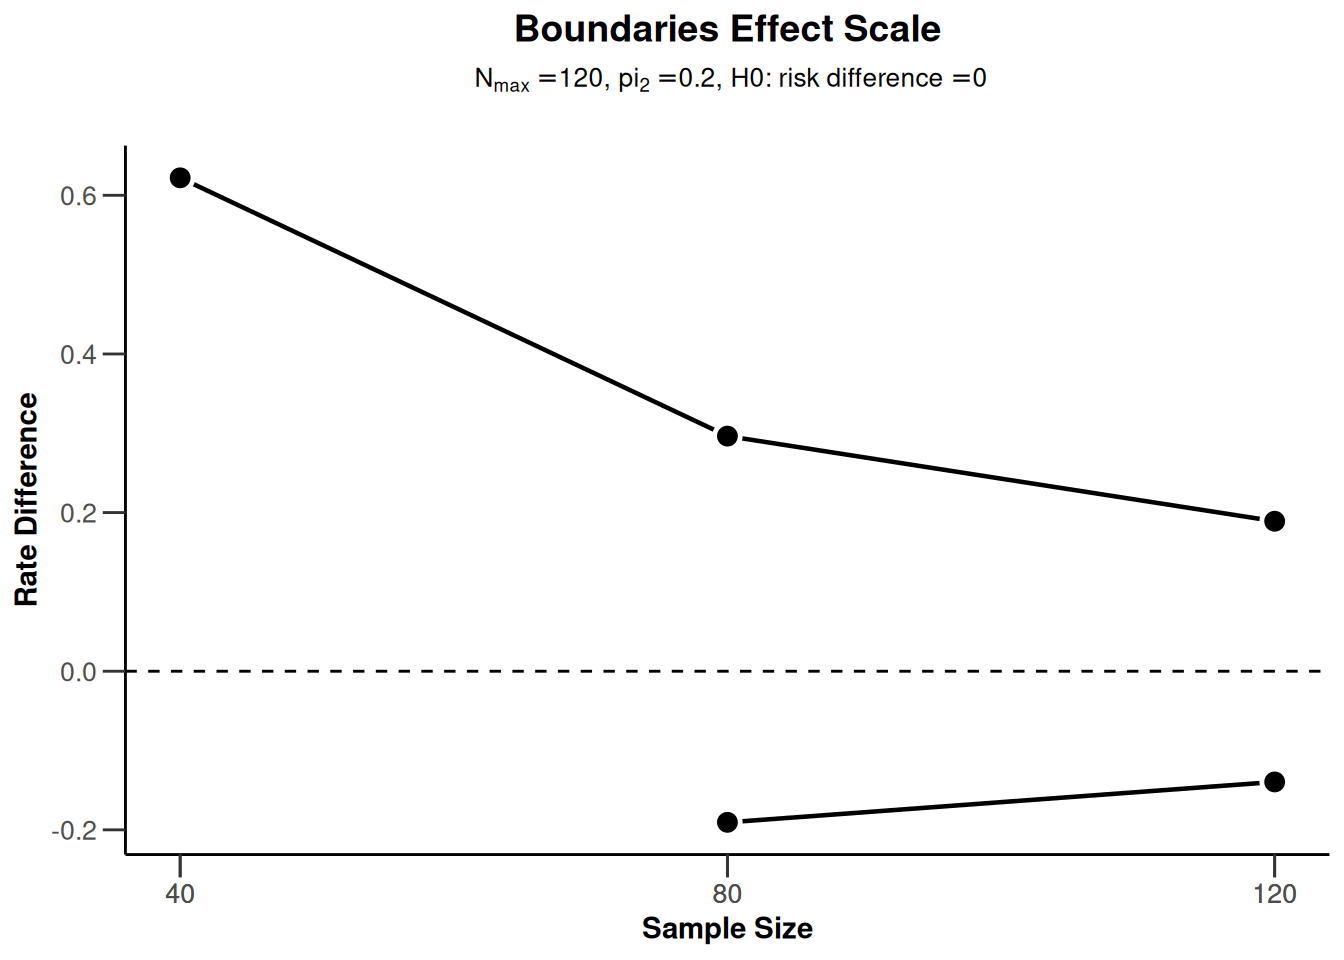
plot(powerRates2, type = 5)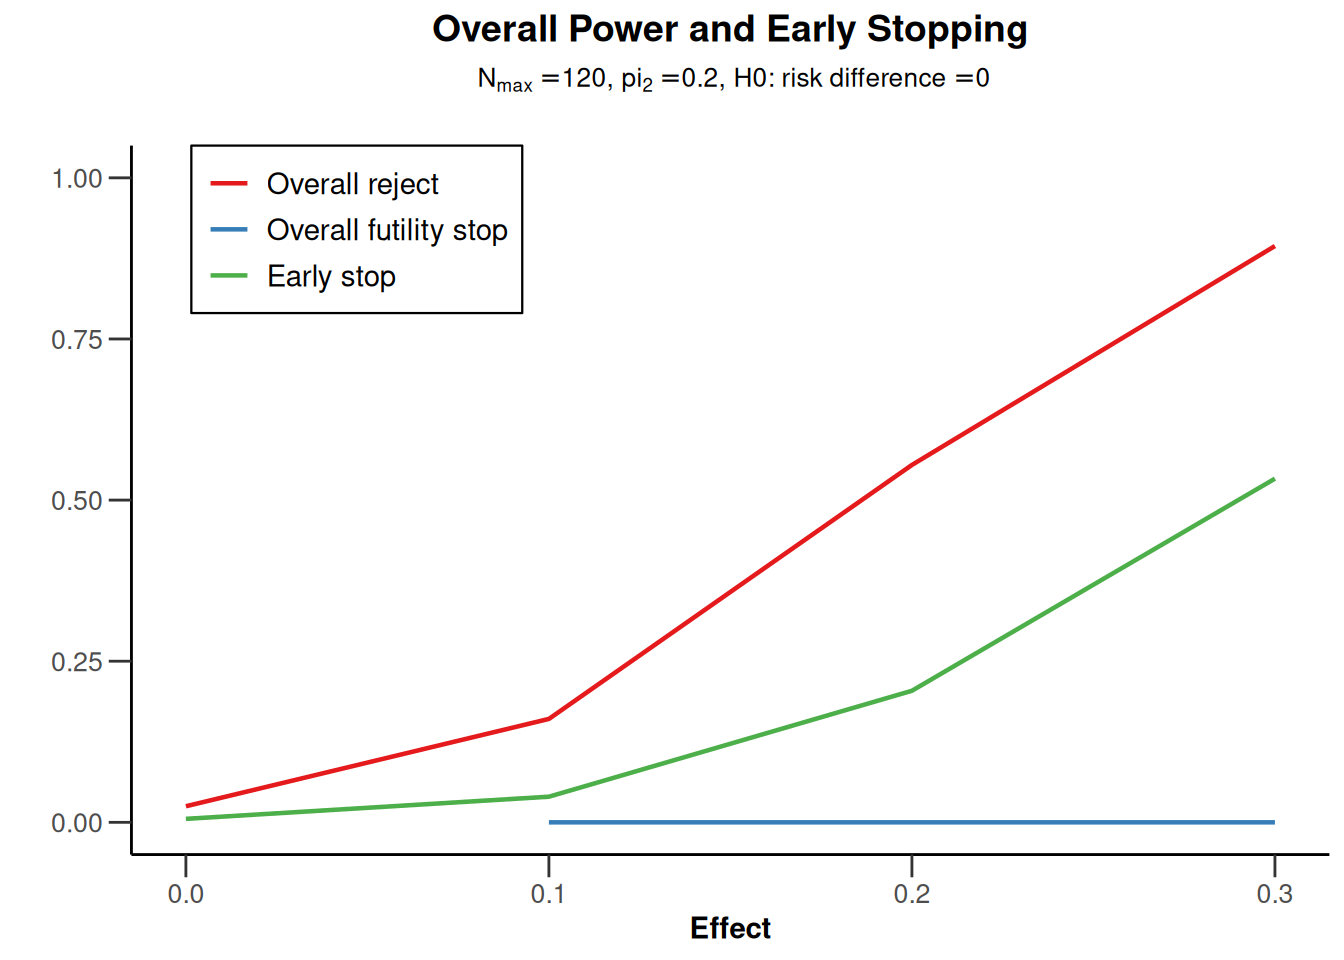
plot(powerRates2, type = 6)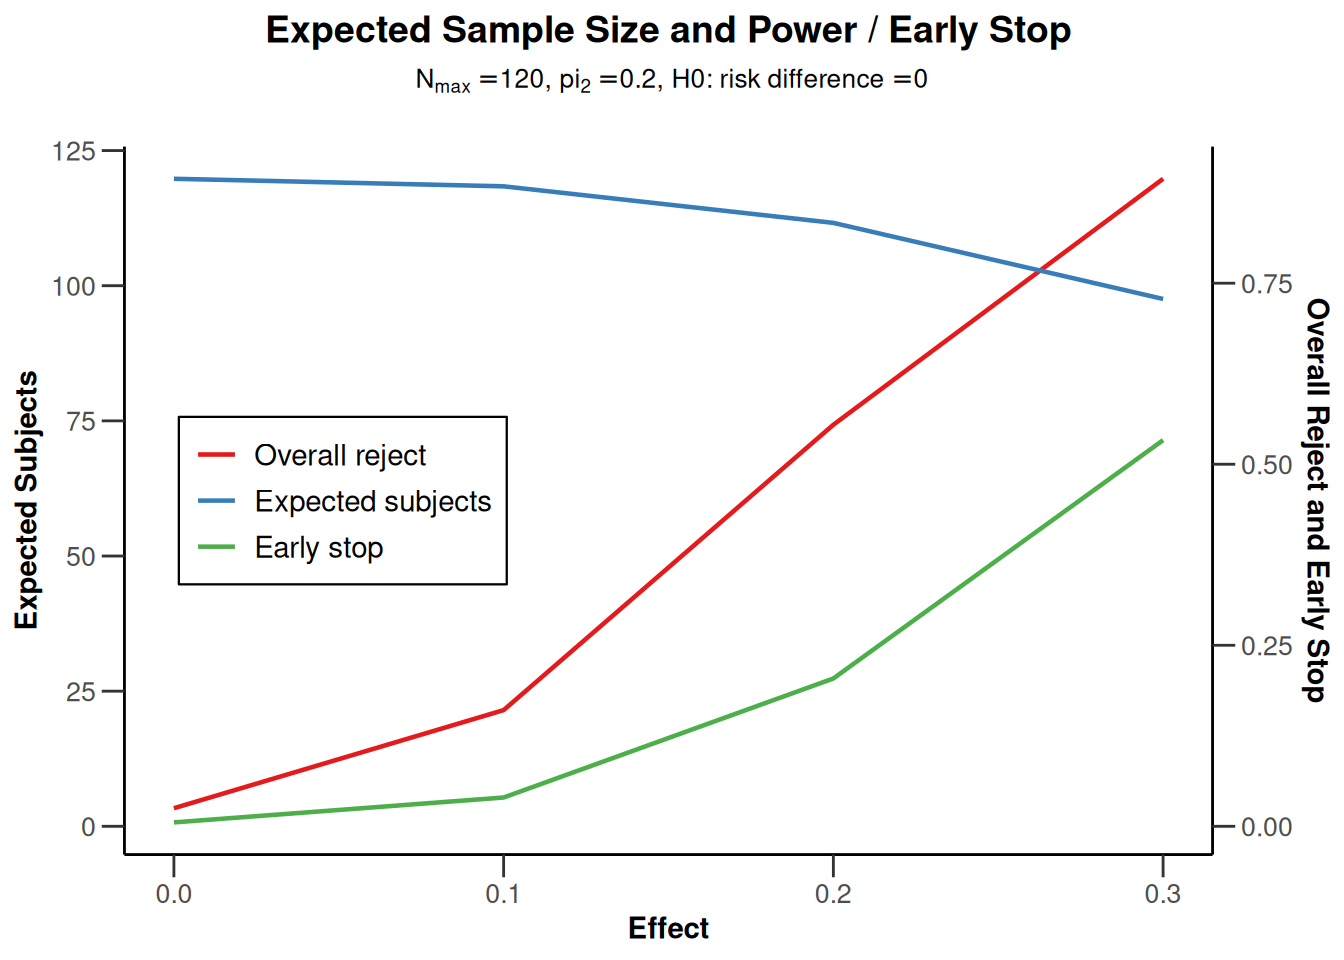
Power survival (survival endpoint)
Power survival for a one-sided design with futility bounds
design <- getDesignGroupSequential(
    kMax = 3,
    typeOfDesign = "OF", sided = 1,
    futilityBounds = c(0, 0)
)

powerSurvival <- getPowerSurvival(
    design = design,
    typeOfComputation = "Schoenfeld", thetaH0 = 1,
    allocationRatioPlanned = 1, kappa = 1,
    maxNumberOfSubjects = 2480,
    maxNumberOfEvents = 70
)

plot(powerSurvival, type = 1)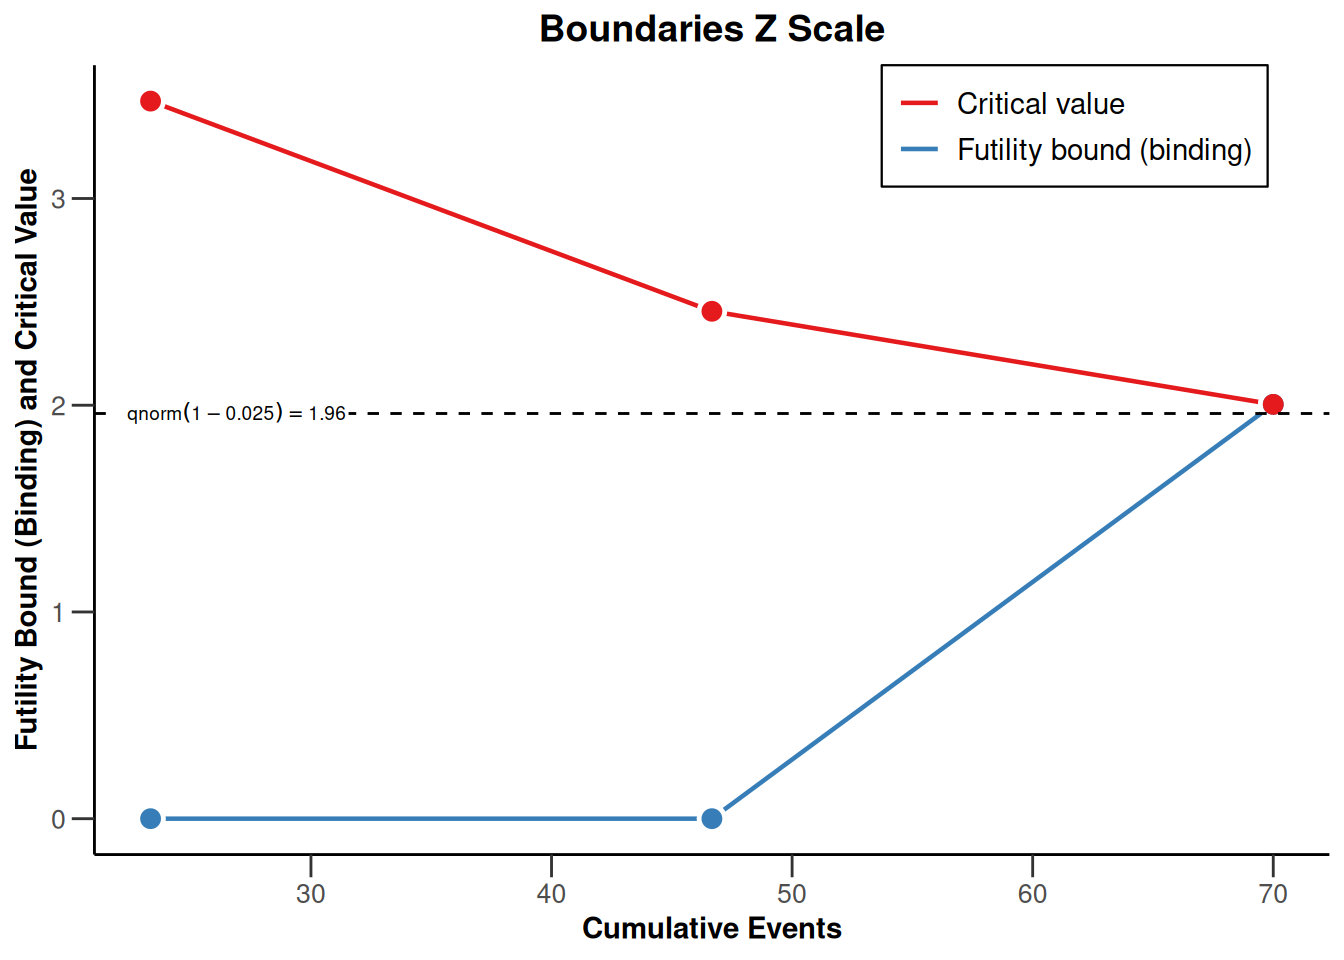
plot(powerSurvival, type = 2)
plot(powerSurvival, type = 5)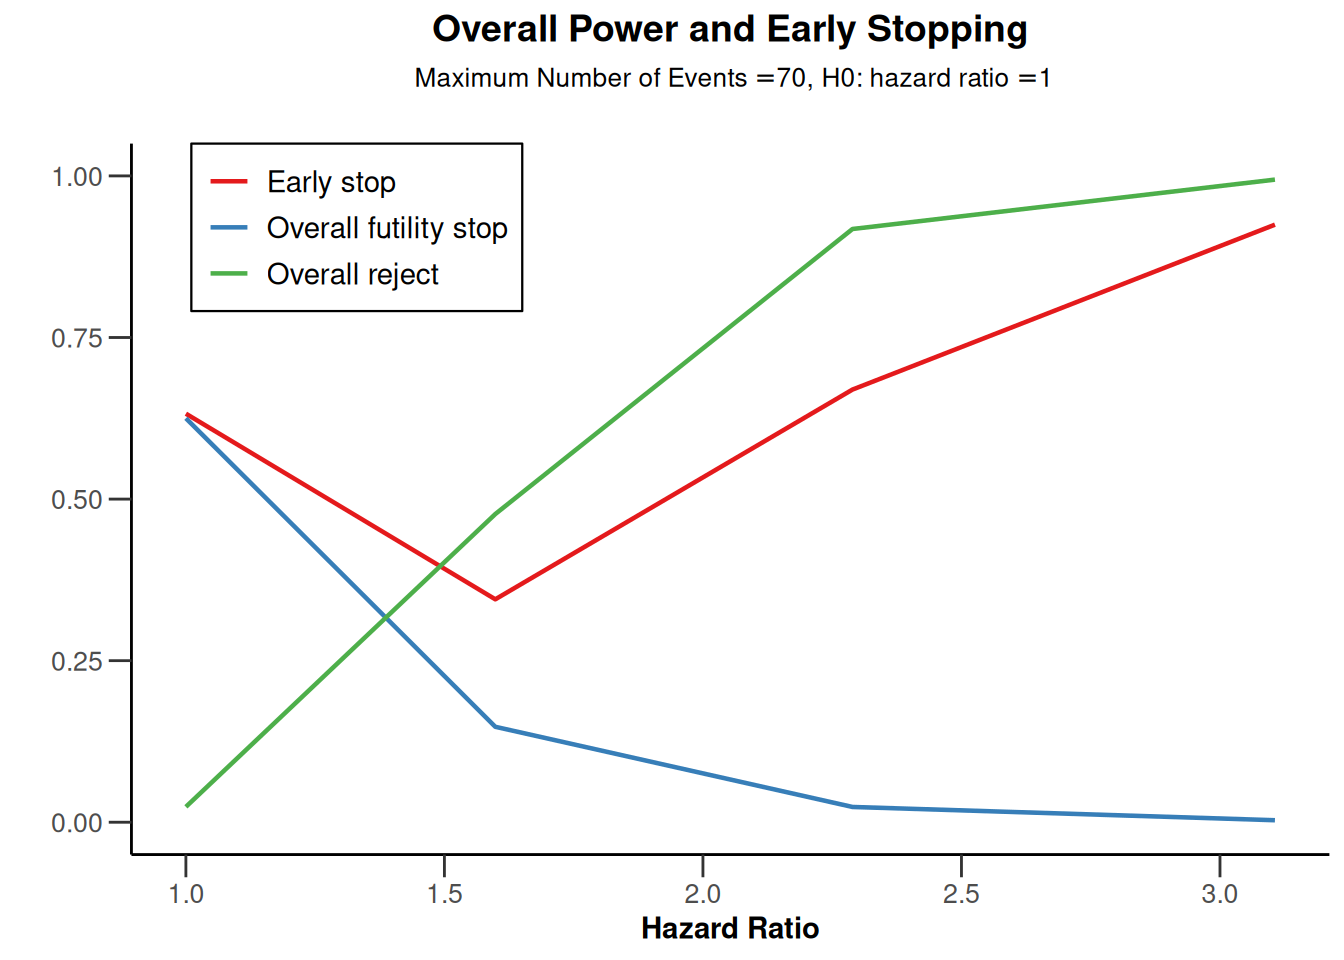
plot(powerSurvival, type = 6)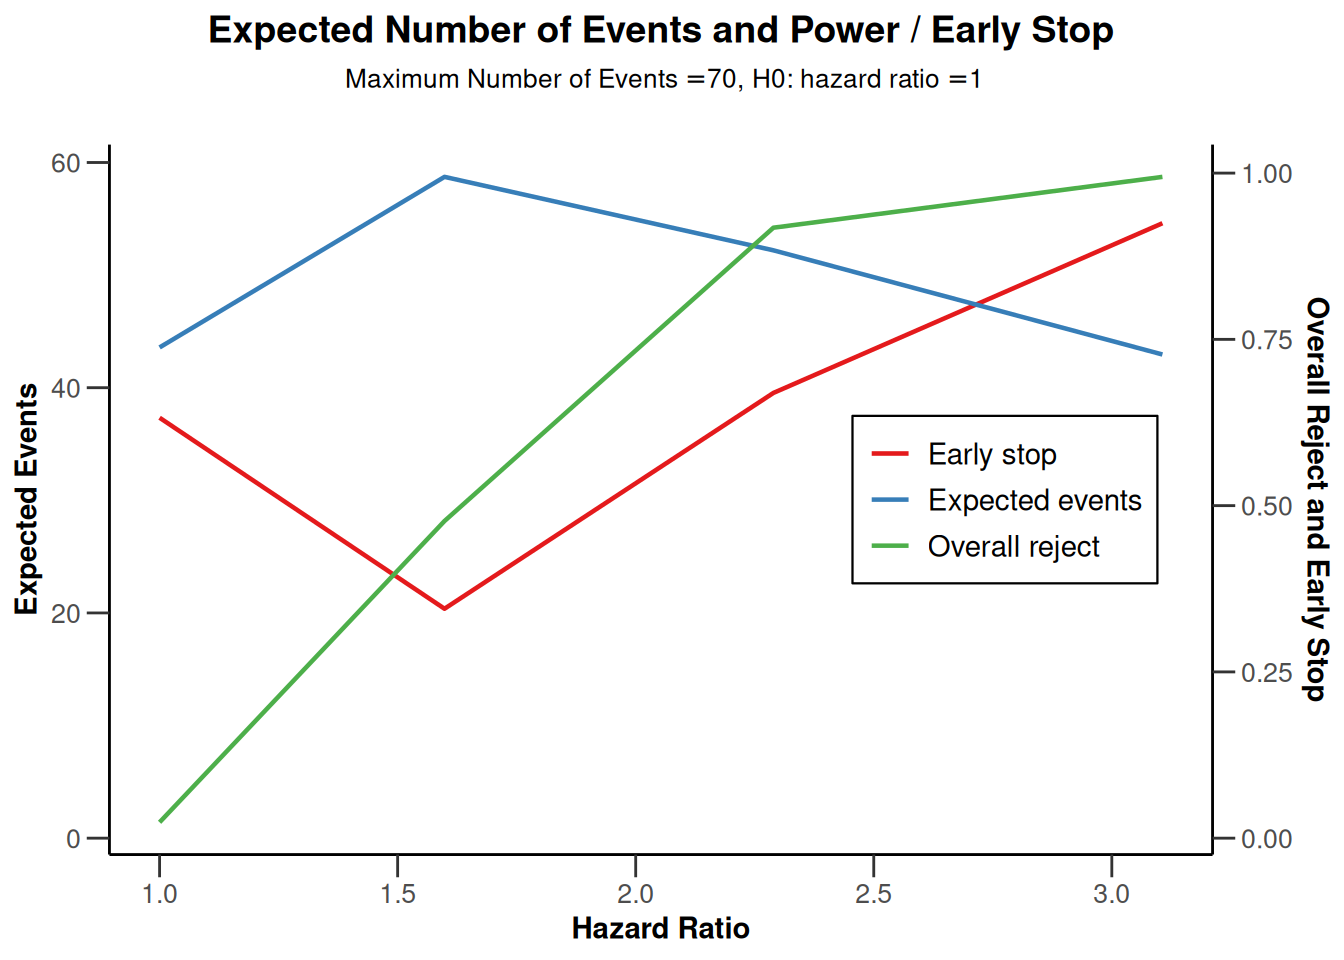
plot(powerSurvival, type = 7)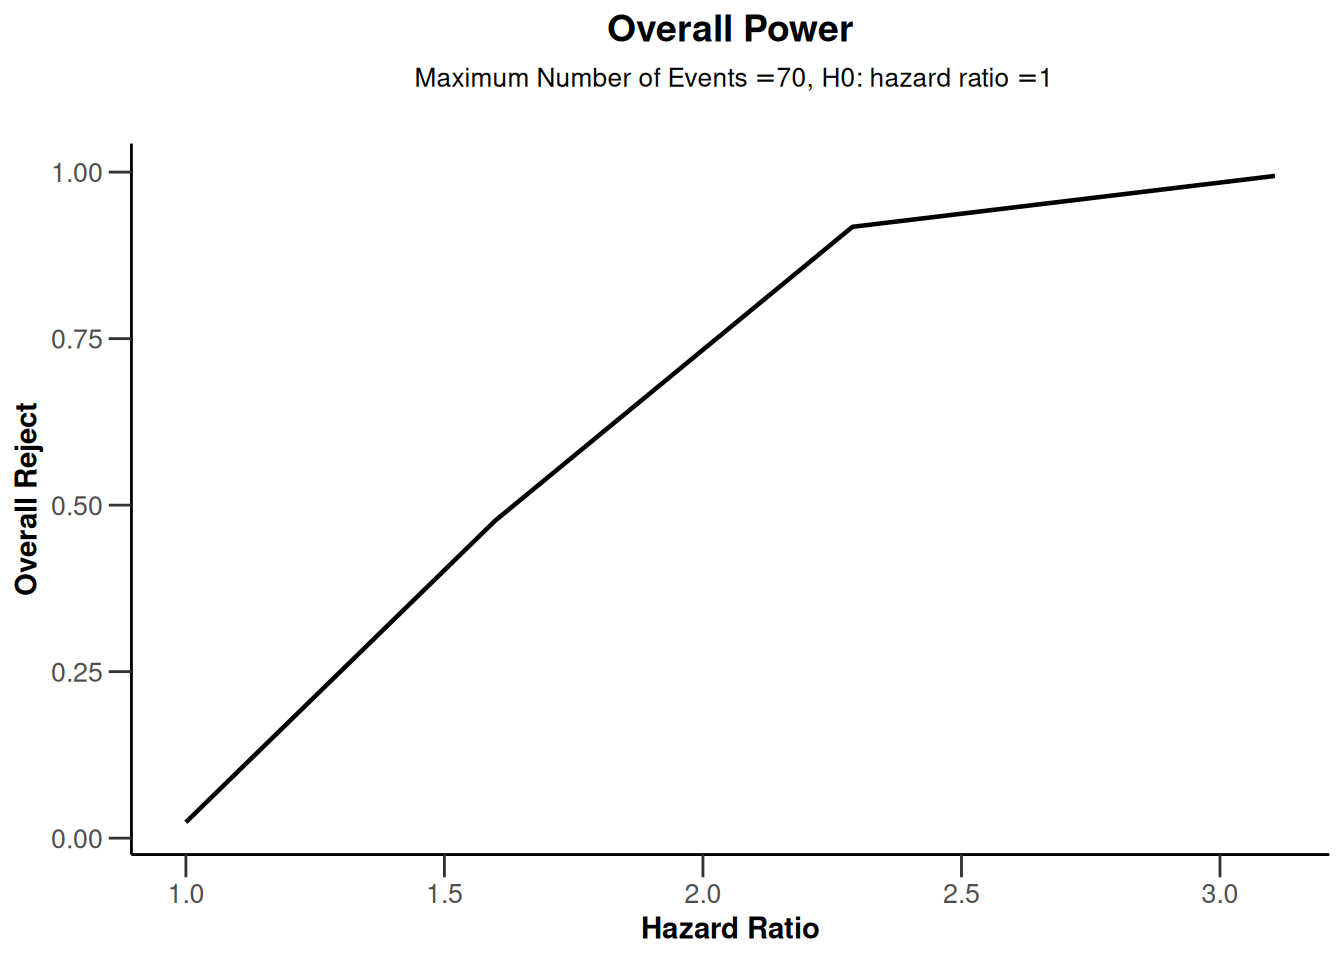
plot(powerSurvival, type = 12)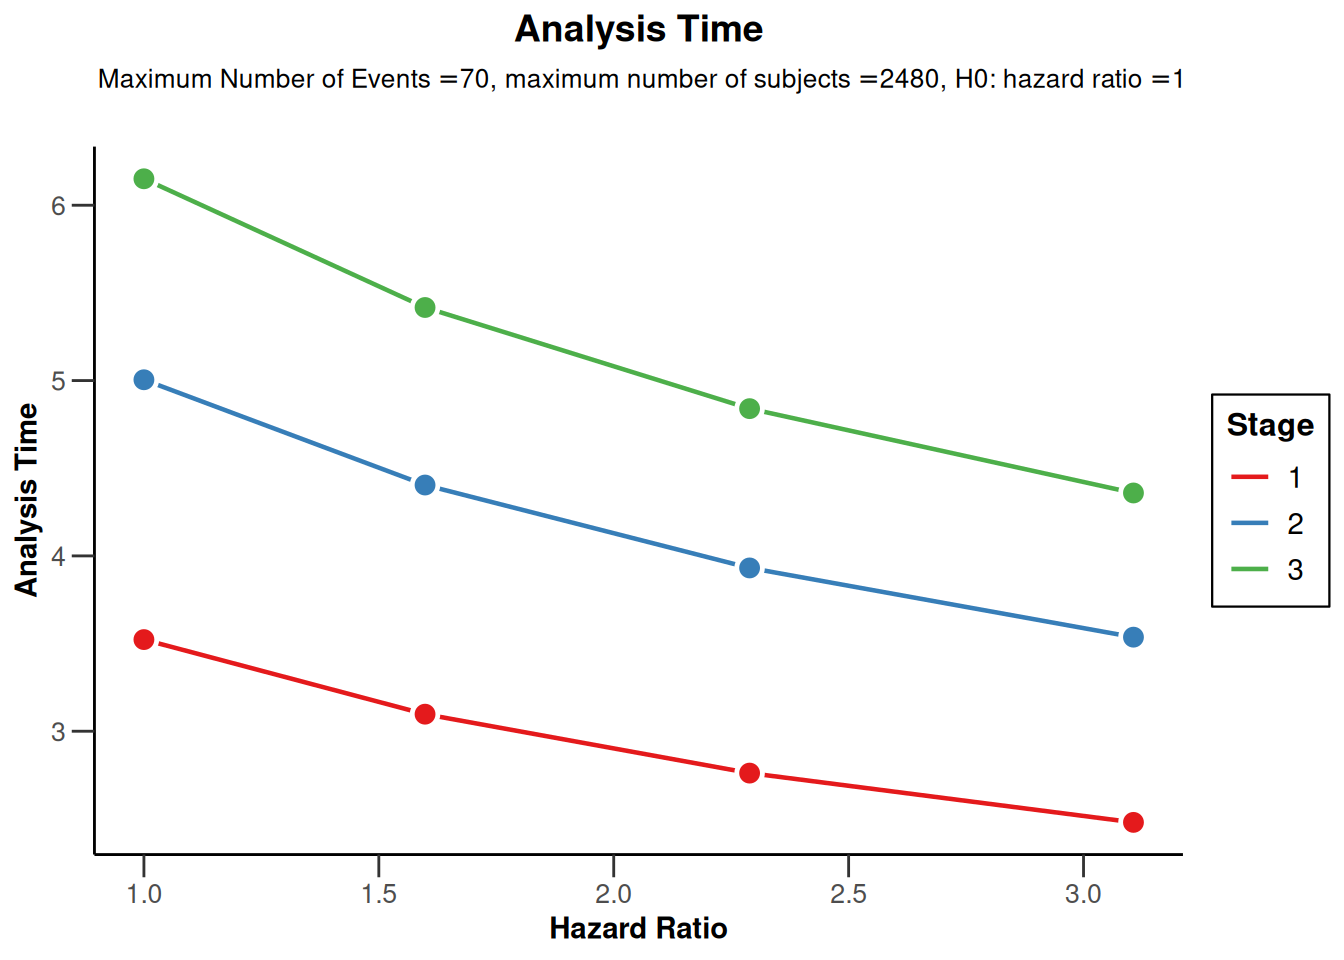
Power for a piecewise exponential survival distribution
design <- getDesignGroupSequential(
    kMax = 3, typeOfDesign = "OF",
    sided = 2, twoSidedPower = TRUE
)
piecewiseSurvivalTime <- list(
    "<5" = 0.04,
    "5 - <10" = 0.02,
    ">= 10" = 0.008
)

powerSurvival1 <- getPowerSurvival(
    design = design,
    typeOfComputation = "Schoenfeld", thetaH0 = 1,
    allocationRatioPlanned = 1, kappa = 1,
    piecewiseSurvivalTime = piecewiseSurvivalTime,
    maxNumberOfSubjects = 2480, maxNumberOfEvents = 70,
    hazardRatio = c(0.5, 2)
)

plot(powerSurvival1, type = 1)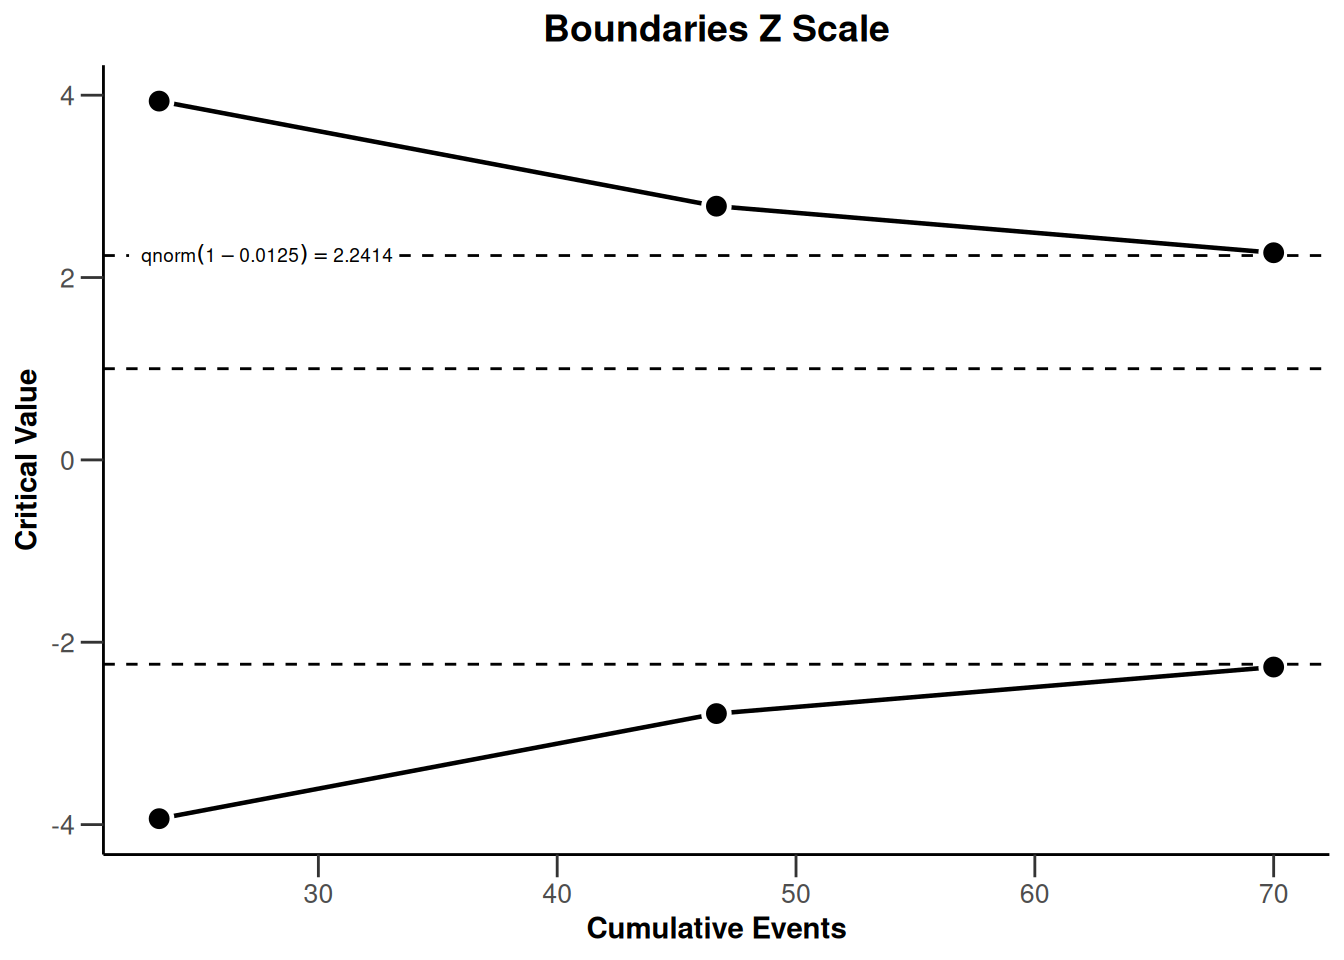
plot(powerSurvival1, type = 2)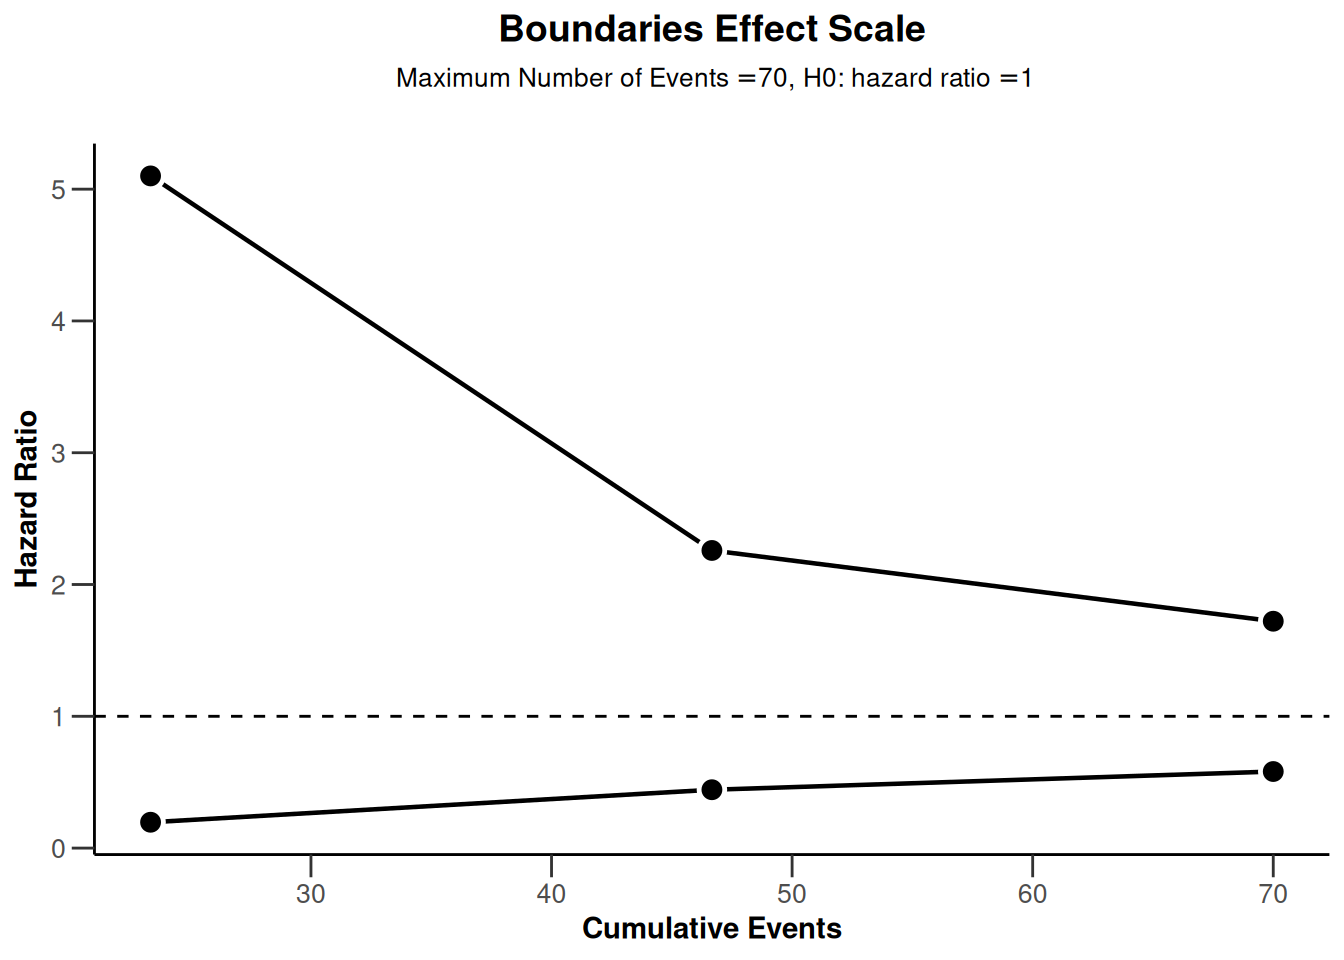
plot(powerSurvival1, type = 12)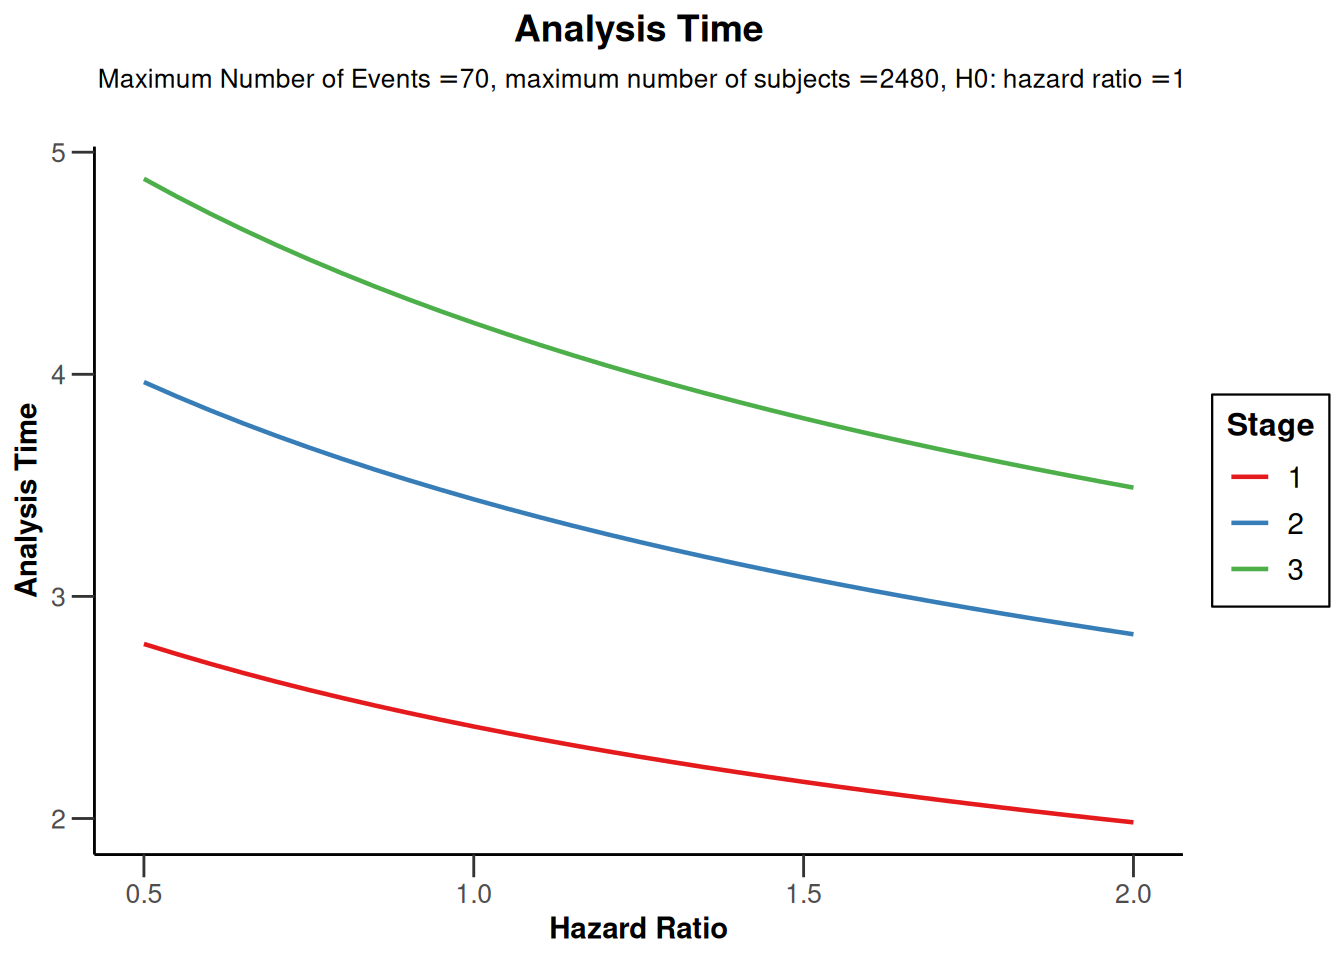
plot(powerSurvival1, type = 13, legendPosition = 1)Warning: Only the first 'hazardRatio' (0.5) was used for plotting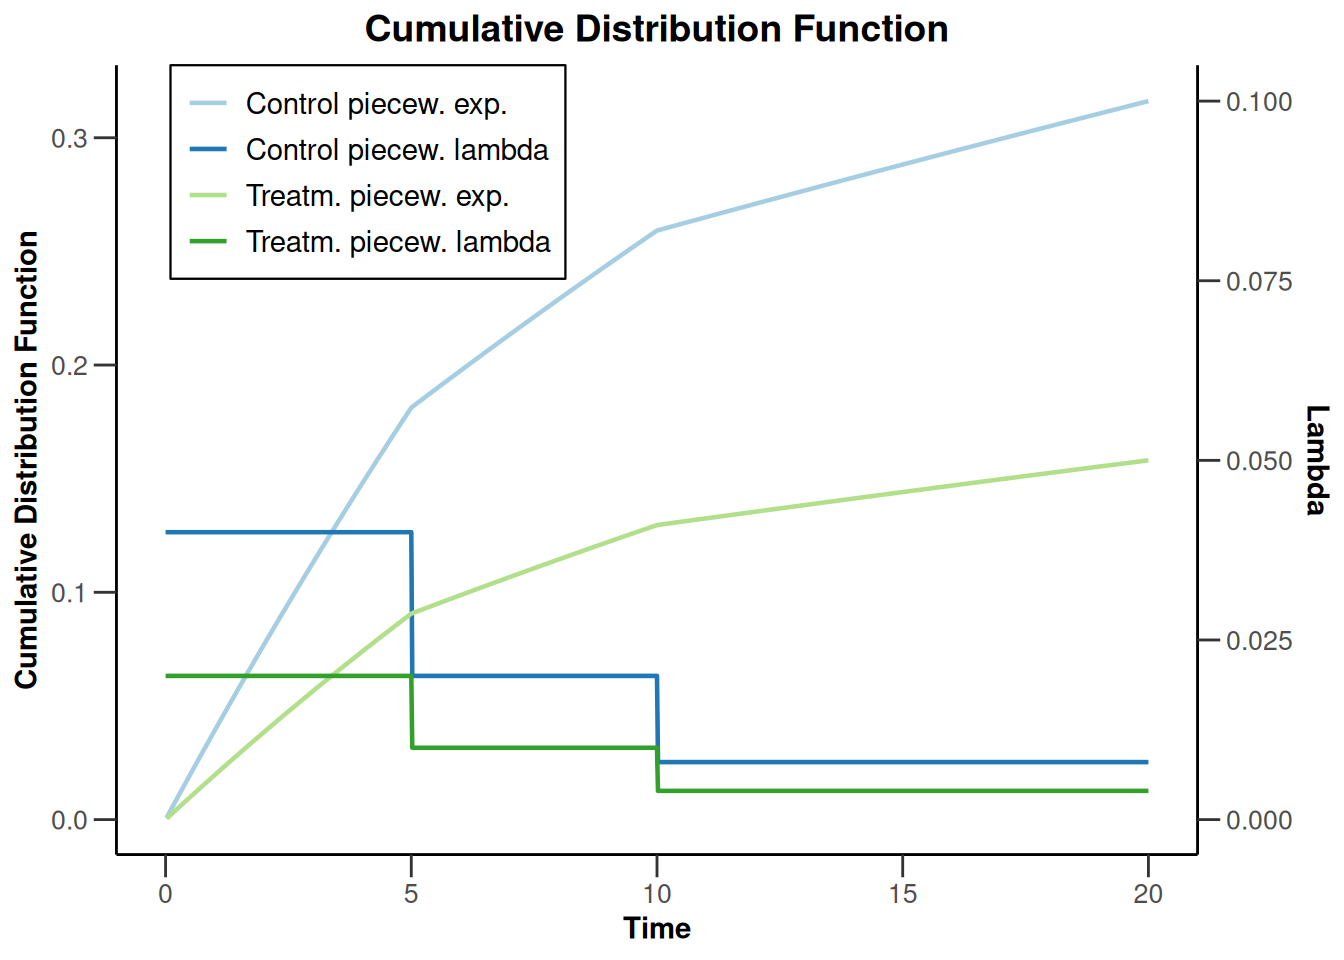
plot(powerSurvival1, type = 14, legendPosition = 5)Warning: Only the first 'hazardRatio' (0.5) was used for plotting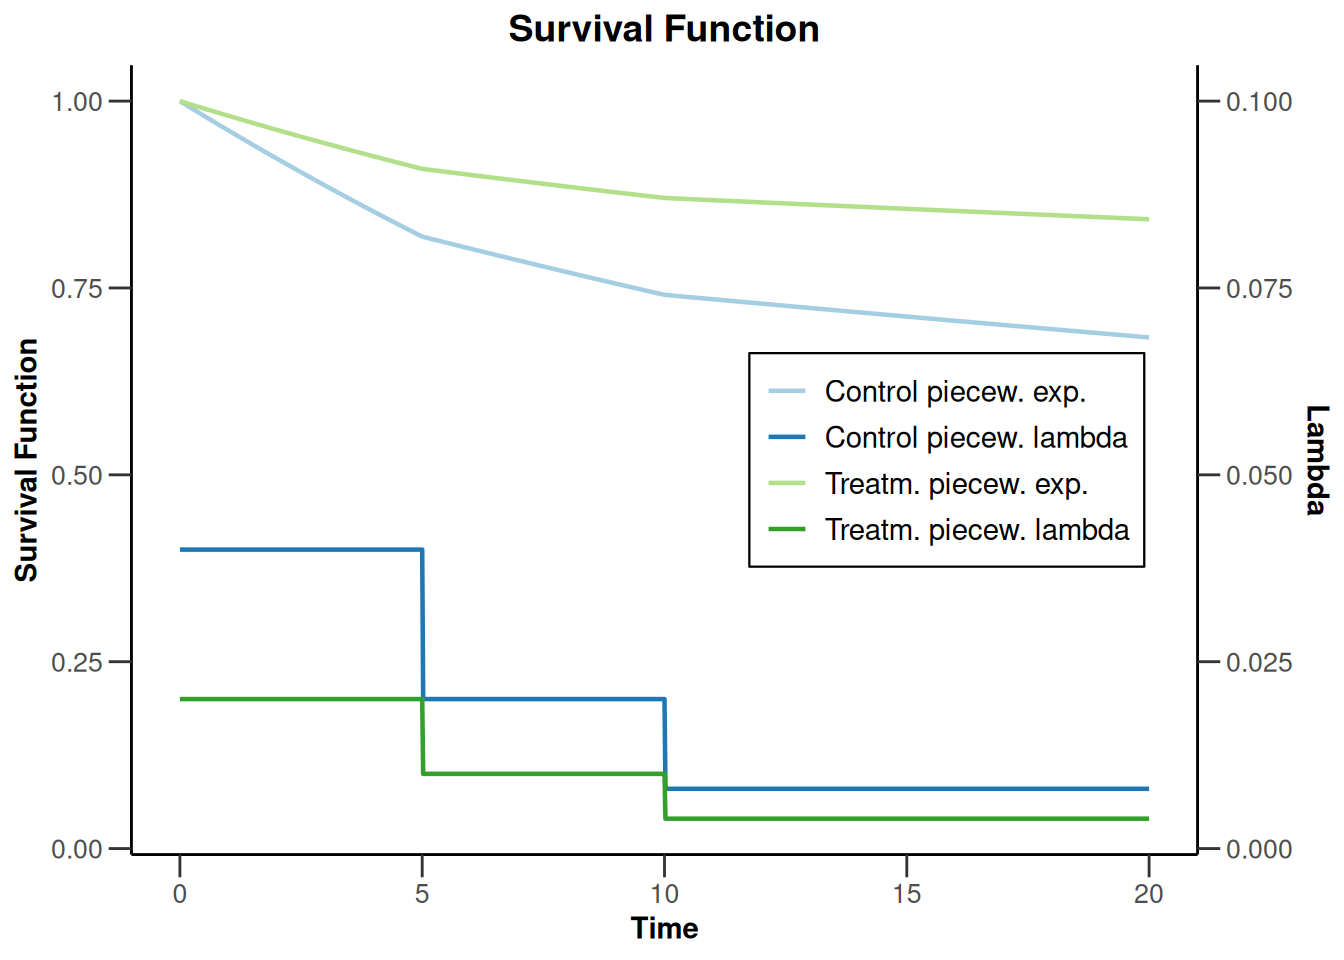
Power for a piecewise exponential survival distribution and a design with futility bounds
design <- getDesignGroupSequential(
    typeOfDesign = "OF", sided = 1,
    futilityBounds = c(0, 0.1)
)

piecewiseSurvivalTime <- list(
    "0 - <6" = 0.025,
    "6 - <9" = 0.04,
    "9 - <15" = 0.015,
    "15 - <21" = 0.01,
    ">= 21" = 0.007
)

powerSurvival2 <- getPowerSurvival(
    design = design,
    typeOfComputation = "Schoenfeld", thetaH0 = 1,
    allocationRatioPlanned = 1, kappa = 1,
    piecewiseSurvivalTime = piecewiseSurvivalTime,
    maxNumberOfSubjects = 2480, maxNumberOfEvents = 70,
    hazardRatio = 0.8
)
plot(powerSurvival2, type = 1)
plot(powerSurvival2, type = 2)
plot(powerSurvival2, type = 13, legendPosition = 1)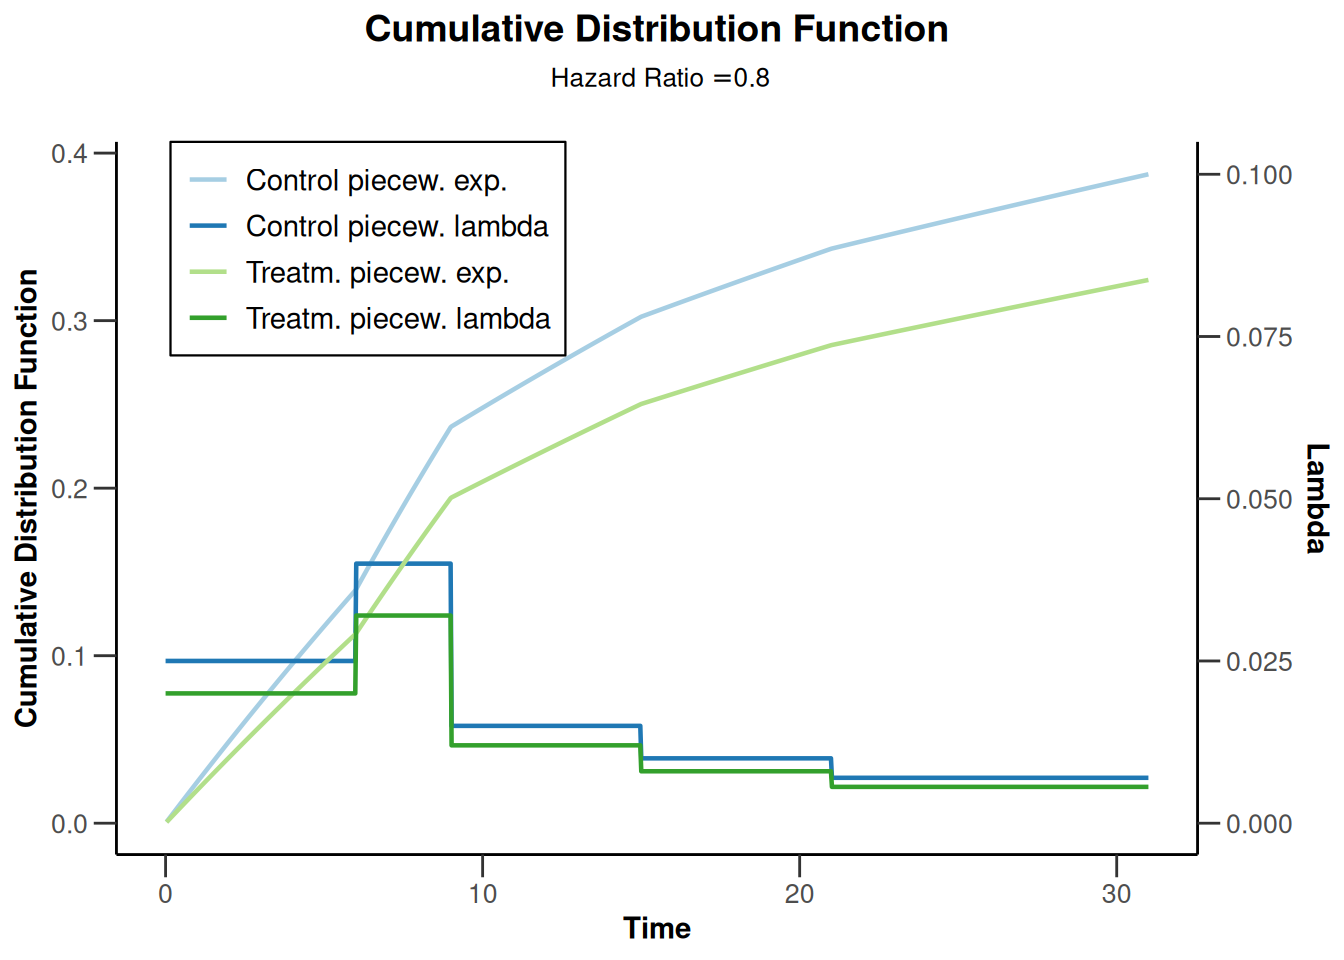
plot(powerSurvival2, type = 14)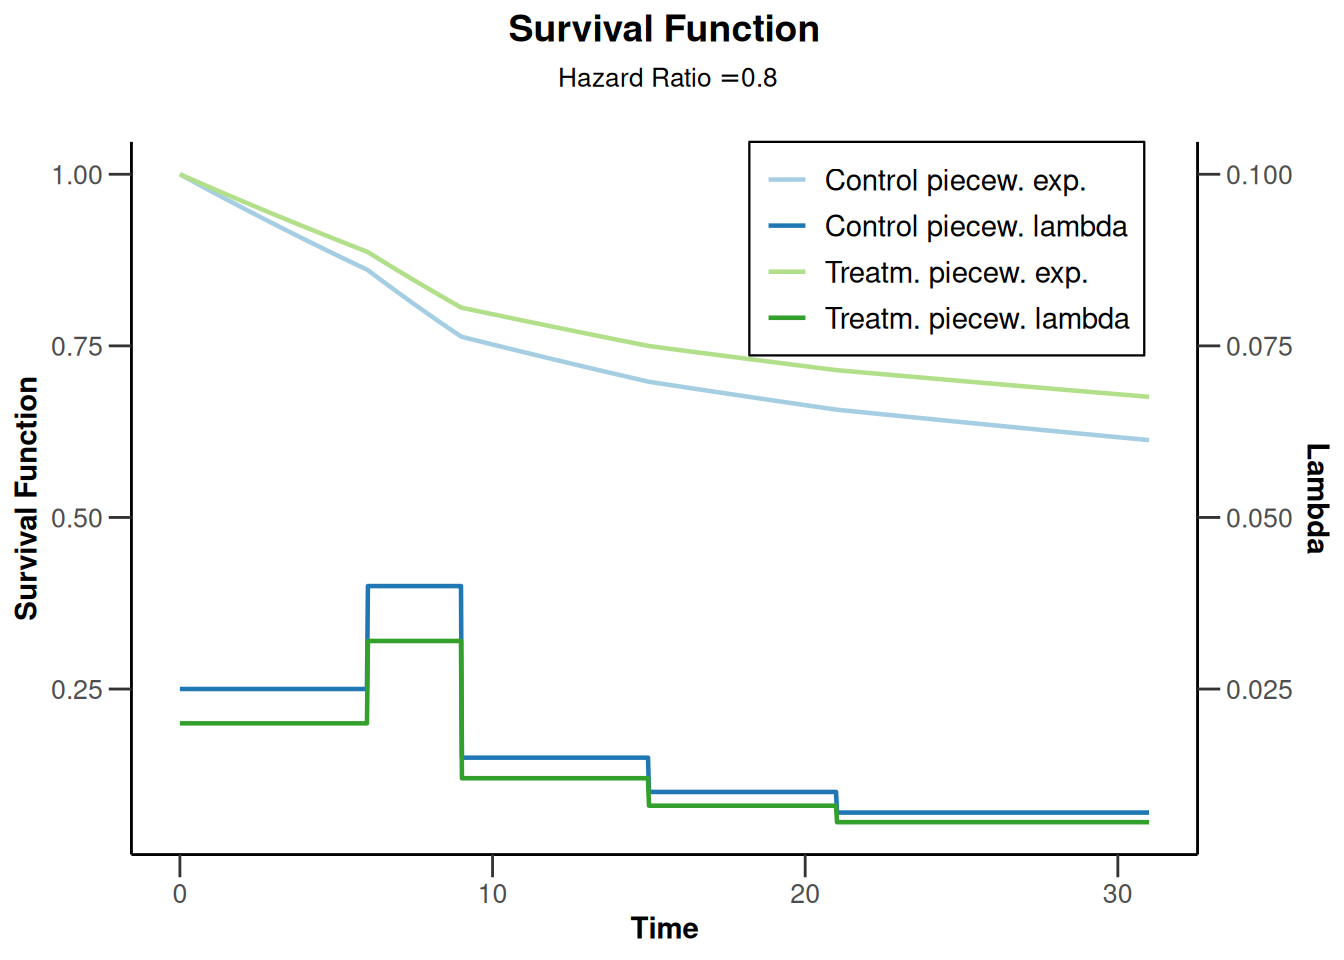
design <- getDesignGroupSequential(
    typeOfDesign = "OF", sided = 1,
    futilityBounds = c(0, 0.1)
)

powerSurvival3 <- getPowerSurvival(
    design = design,
    typeOfComputation = "Schoenfeld", thetaH0 = 1,
    allocationRatioPlanned = 1, kappa = 1,
    piecewiseSurvivalTime = c(0, 5, 10),
    lambda2 = c(0.025, 0.04, 0.015),
    lambda1 = c(0.02, 0.032, 0.012),
    maxNumberOfSubjects = 2480, maxNumberOfEvents = 70
)

plot(powerSurvival3, type = 1)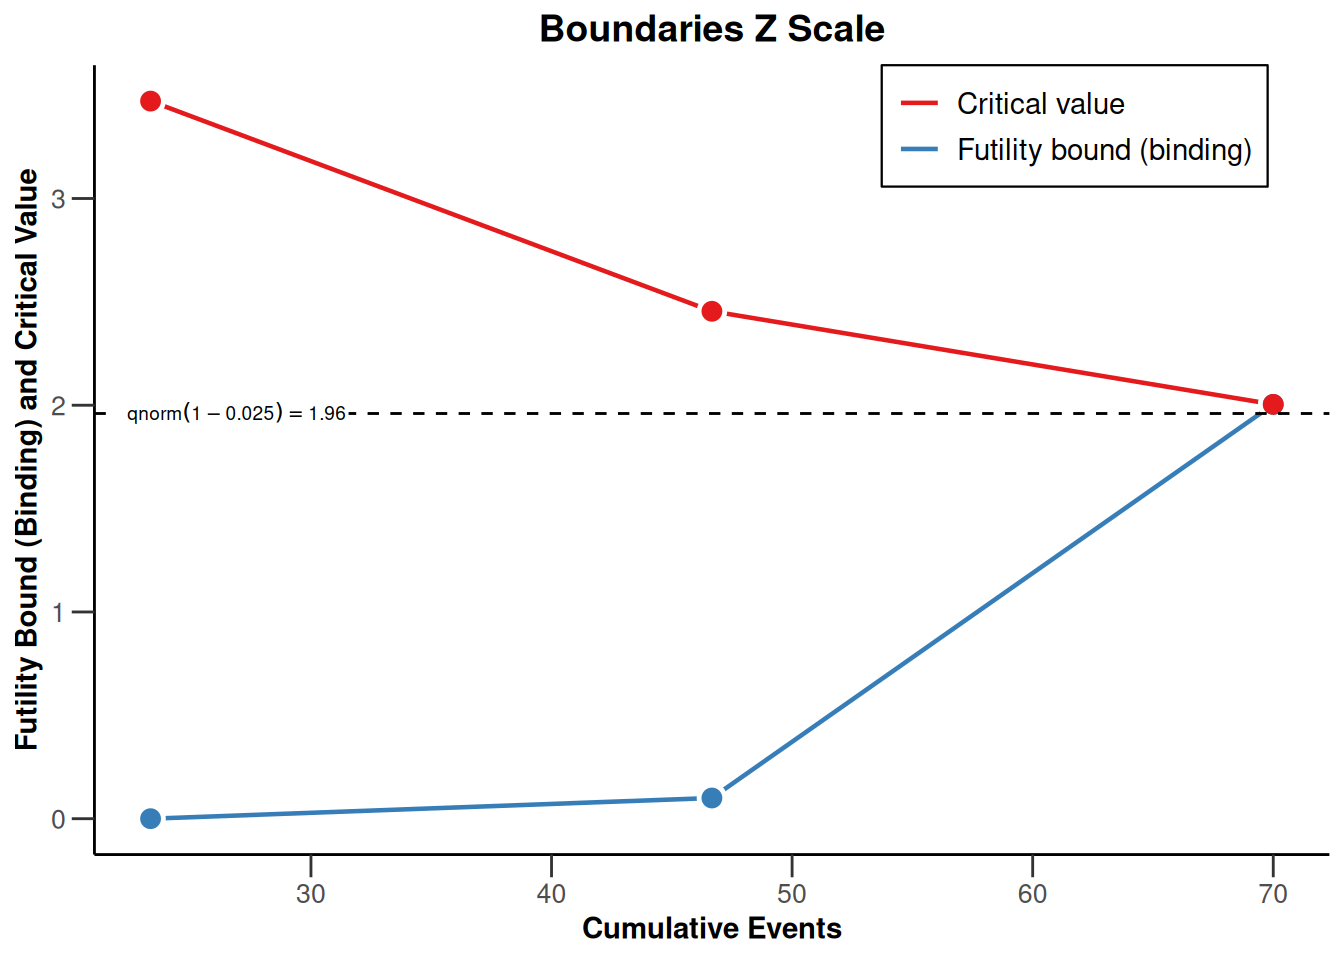
plot(powerSurvival3, type = 2)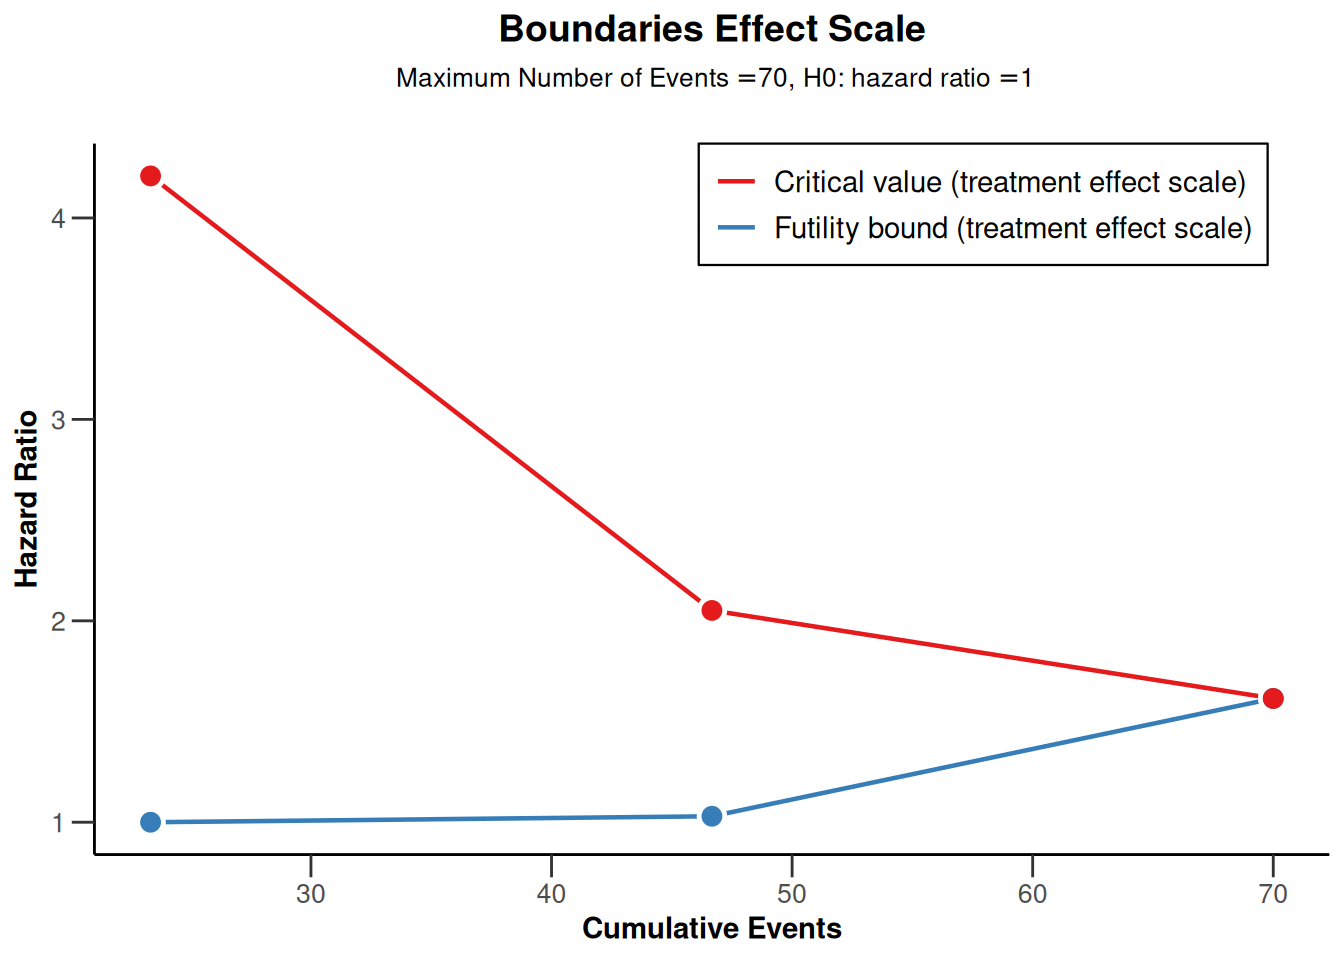
plot(powerSurvival3, type = 13, legendPosition = 1)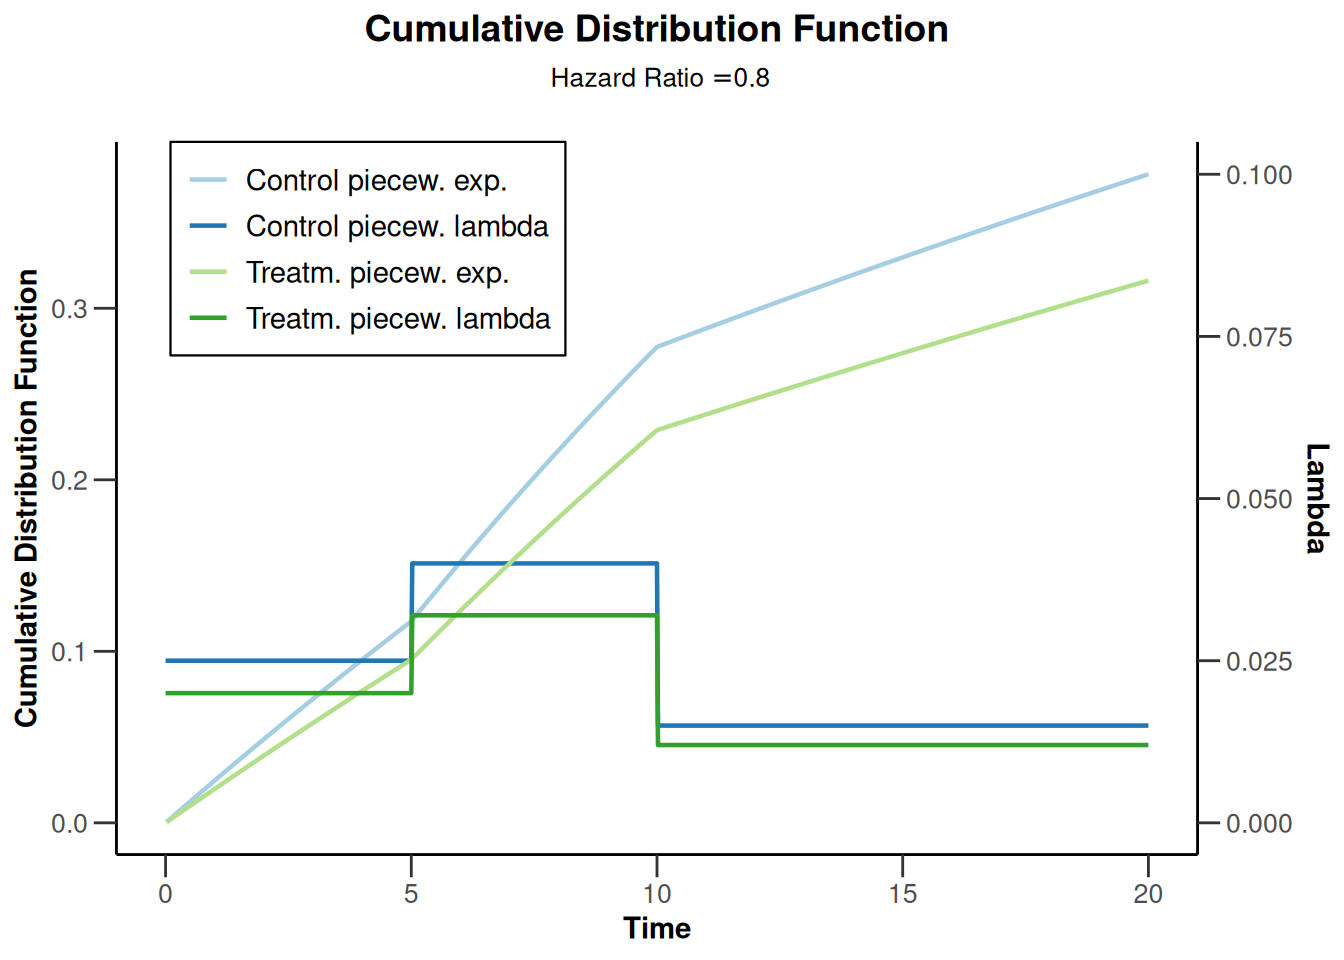
plot(powerSurvival2, type = 14)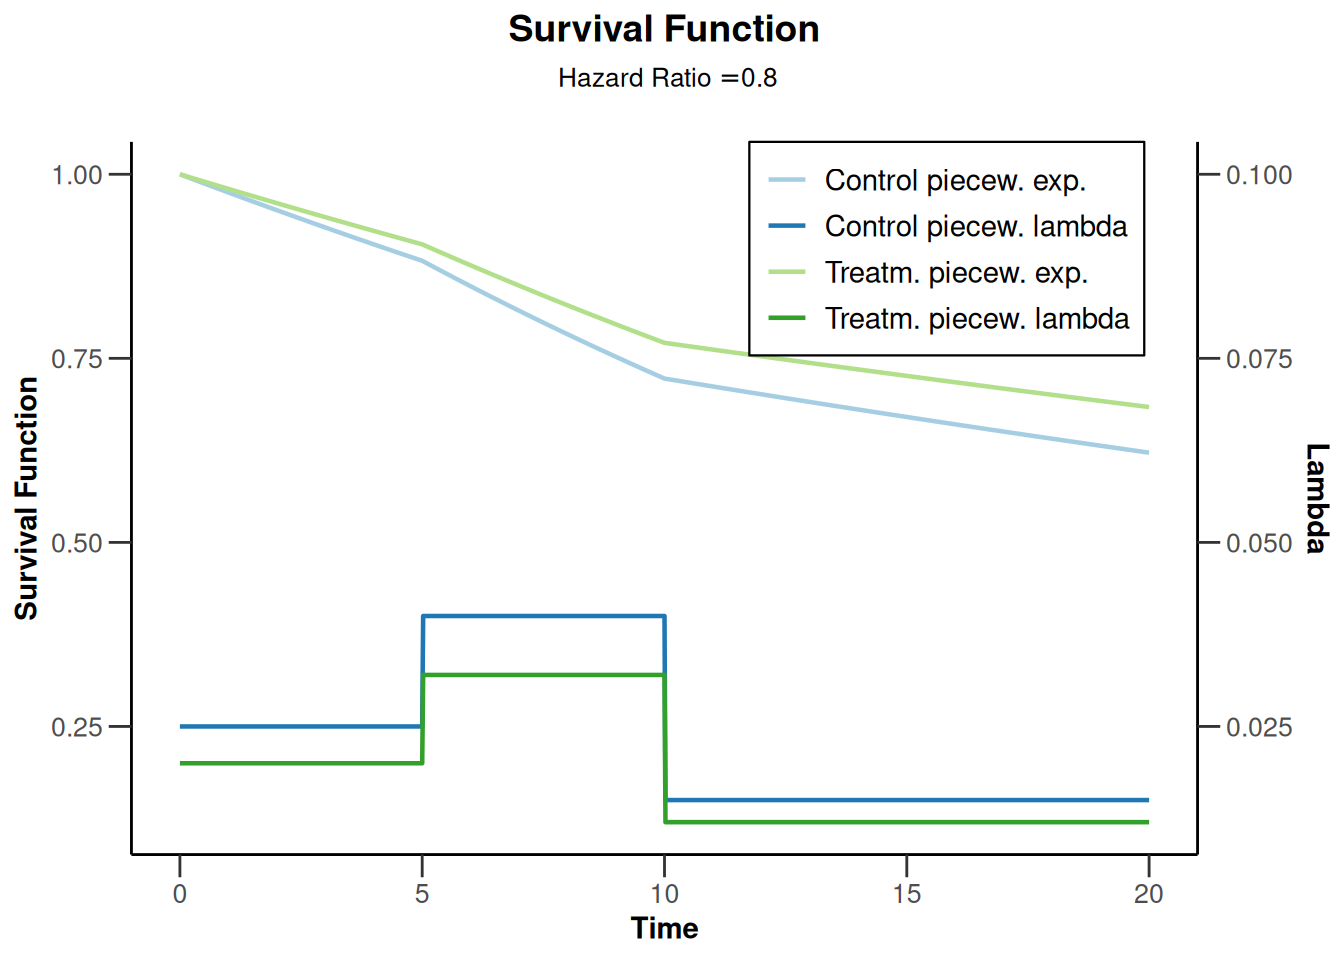
Power survival for one lambda
powerSurvival4 <- getPowerSurvival(
    accrualTime = 12,
    lambda2 = 0.04,
    hazardRatio = 0.6,
    maxNumberOfSubjects = 1400,
    maxNumberOfEvents = 300
)

plot(powerSurvival4, type = 13, legendPosition = 1)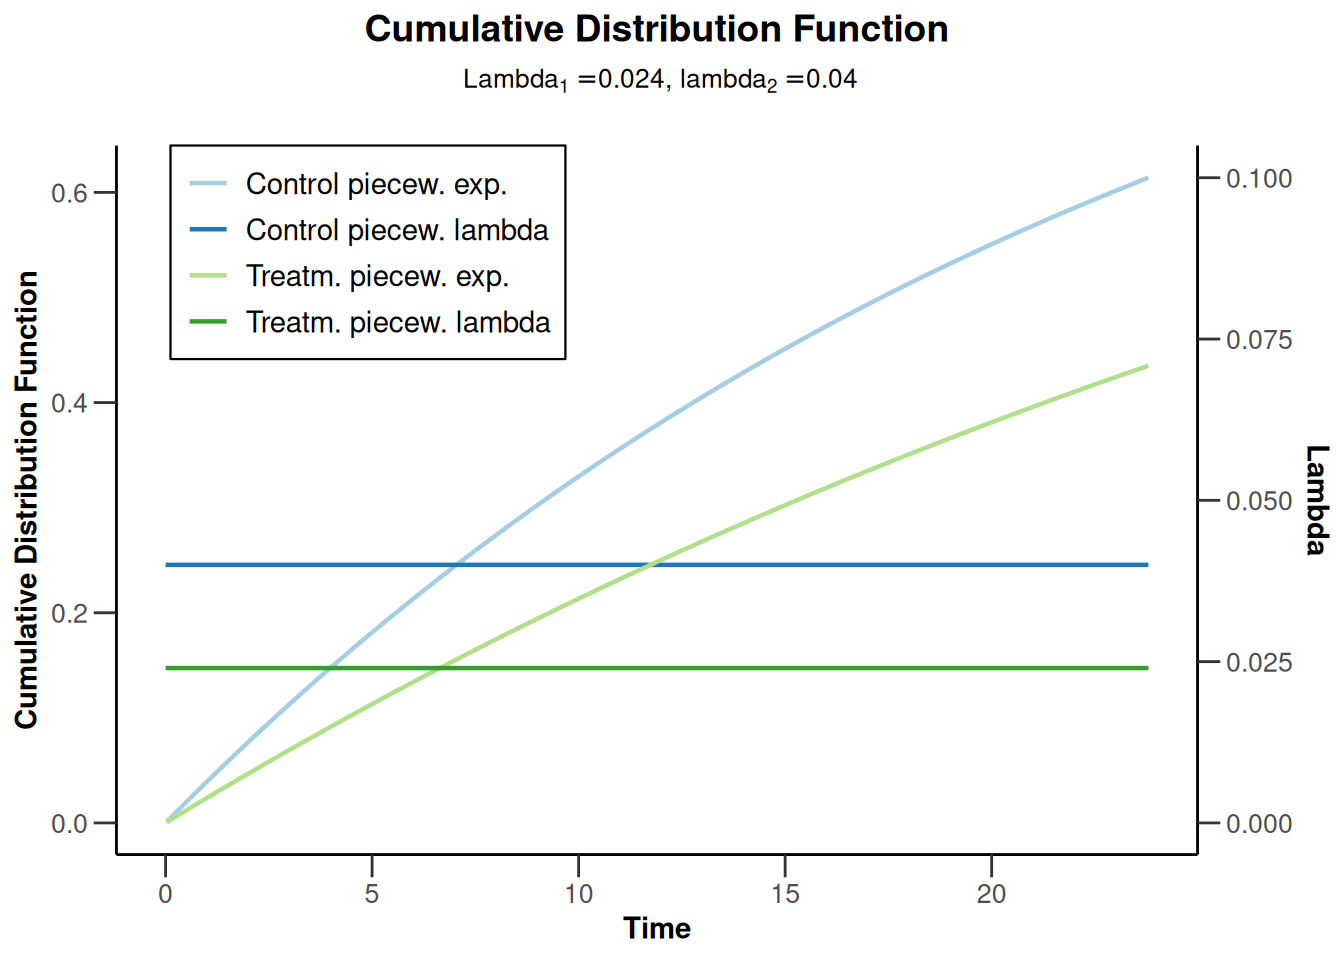
plot(powerSurvival4, type = 14, legendPosition = 5)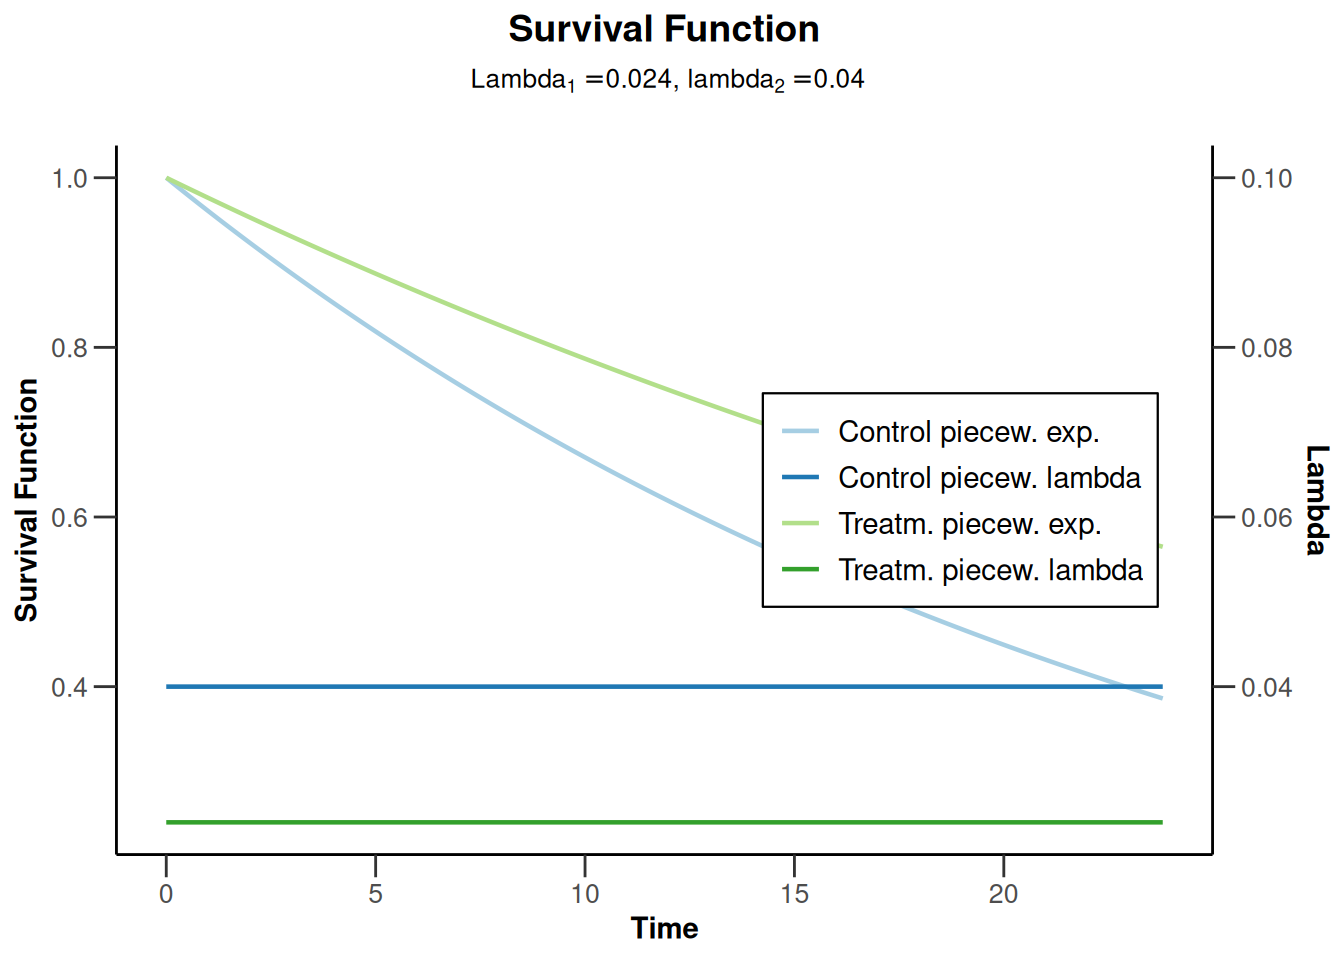
Power survival for default pi1 and pi2
powerSurvival5 <- getPowerSurvival(
    maxNumberOfSubjects = 1400,
    maxNumberOfEvents = 300
)

plot(powerSurvival5, type = 13, legendPosition = 1)
Warning: Only the first 'pi1' (0.2) was used for plotting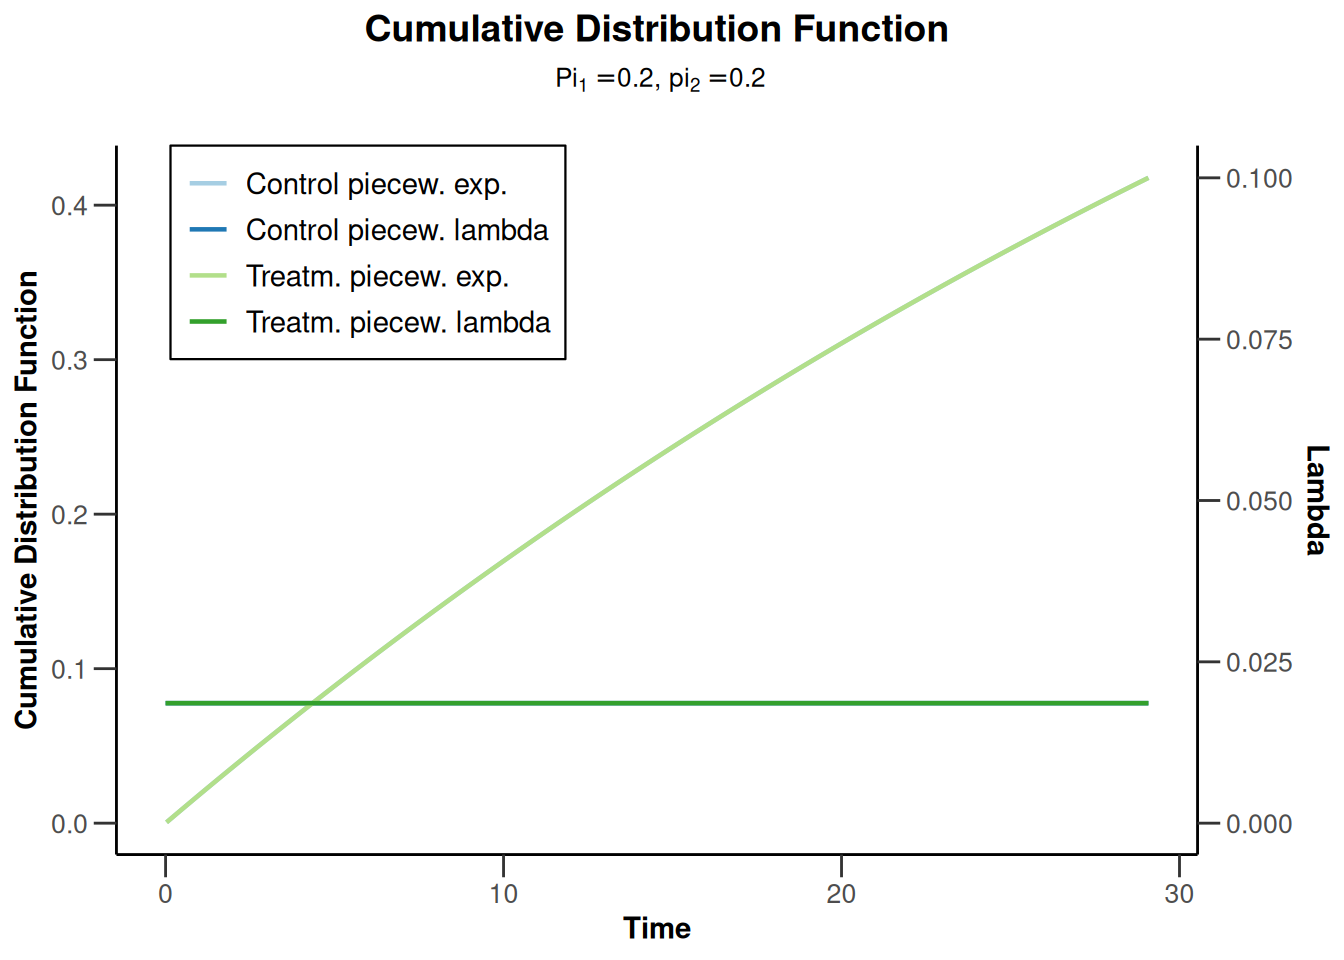
plot(powerSurvival5, type = 14, legendPosition = 5)Warning: Only the first 'pi1' (0.2) was used for plotting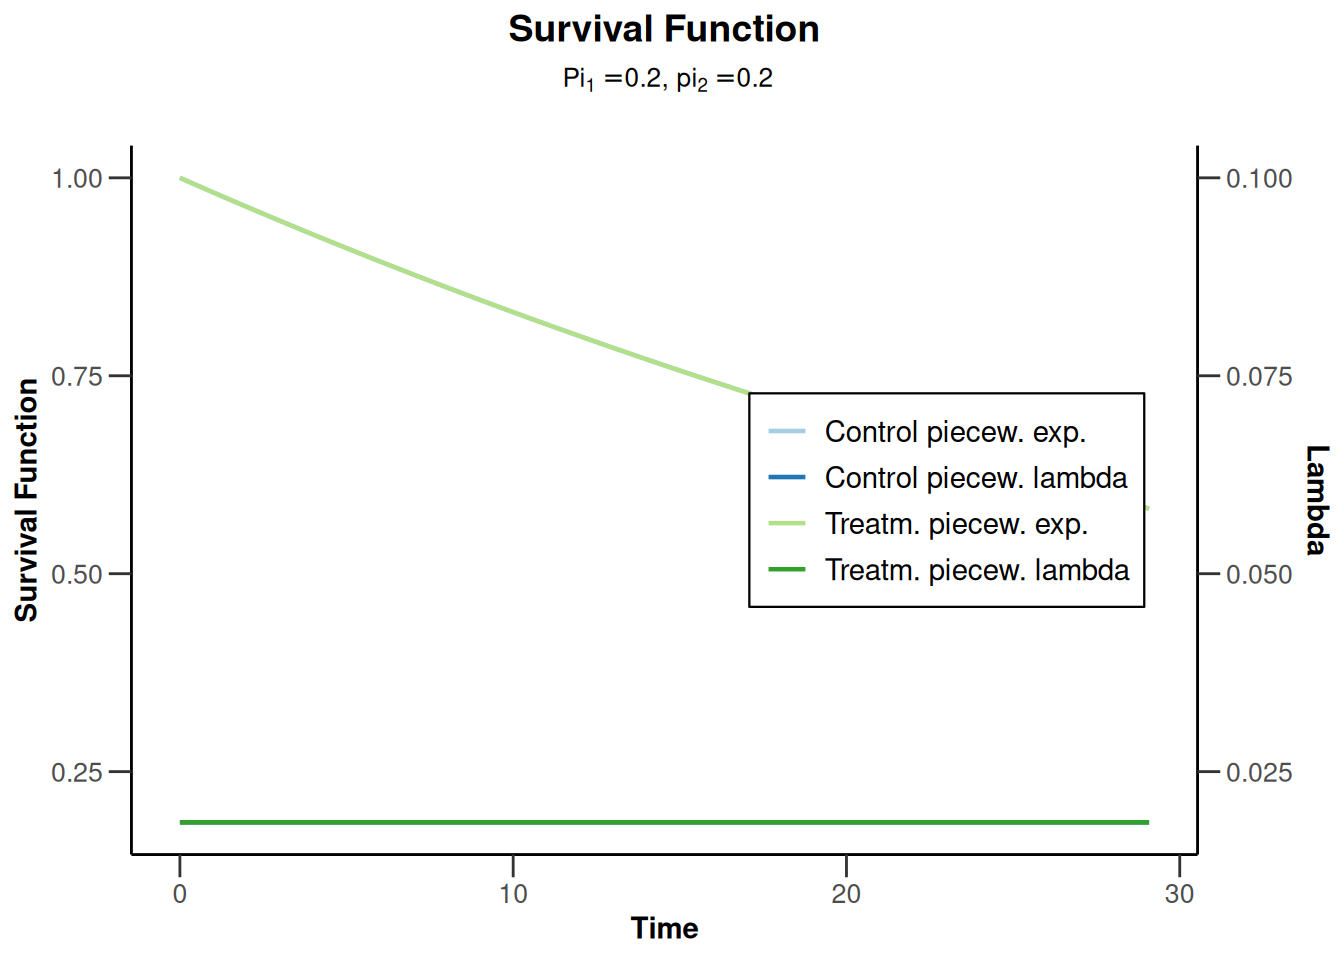
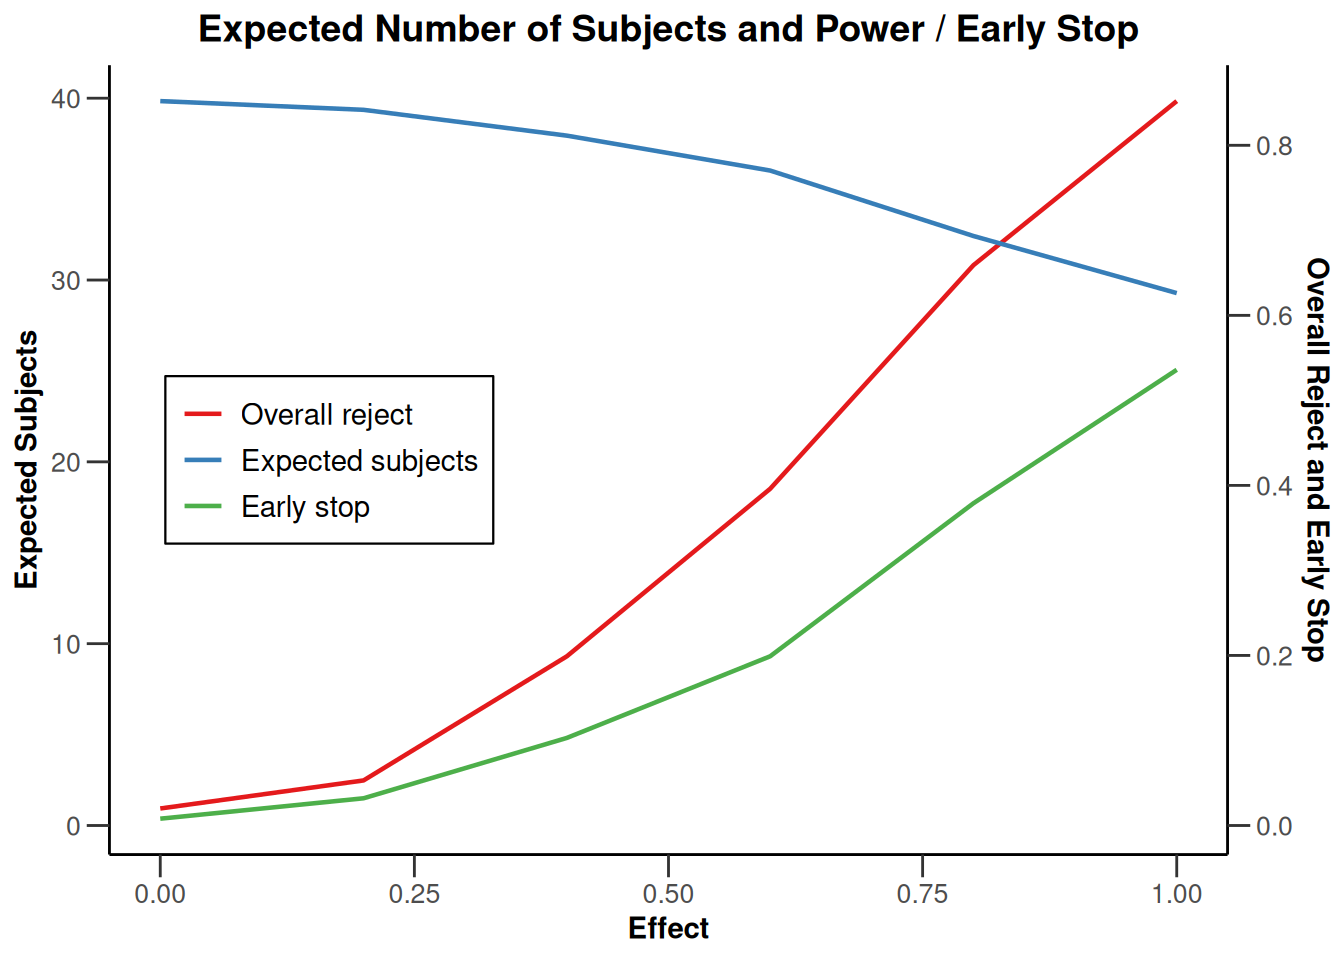
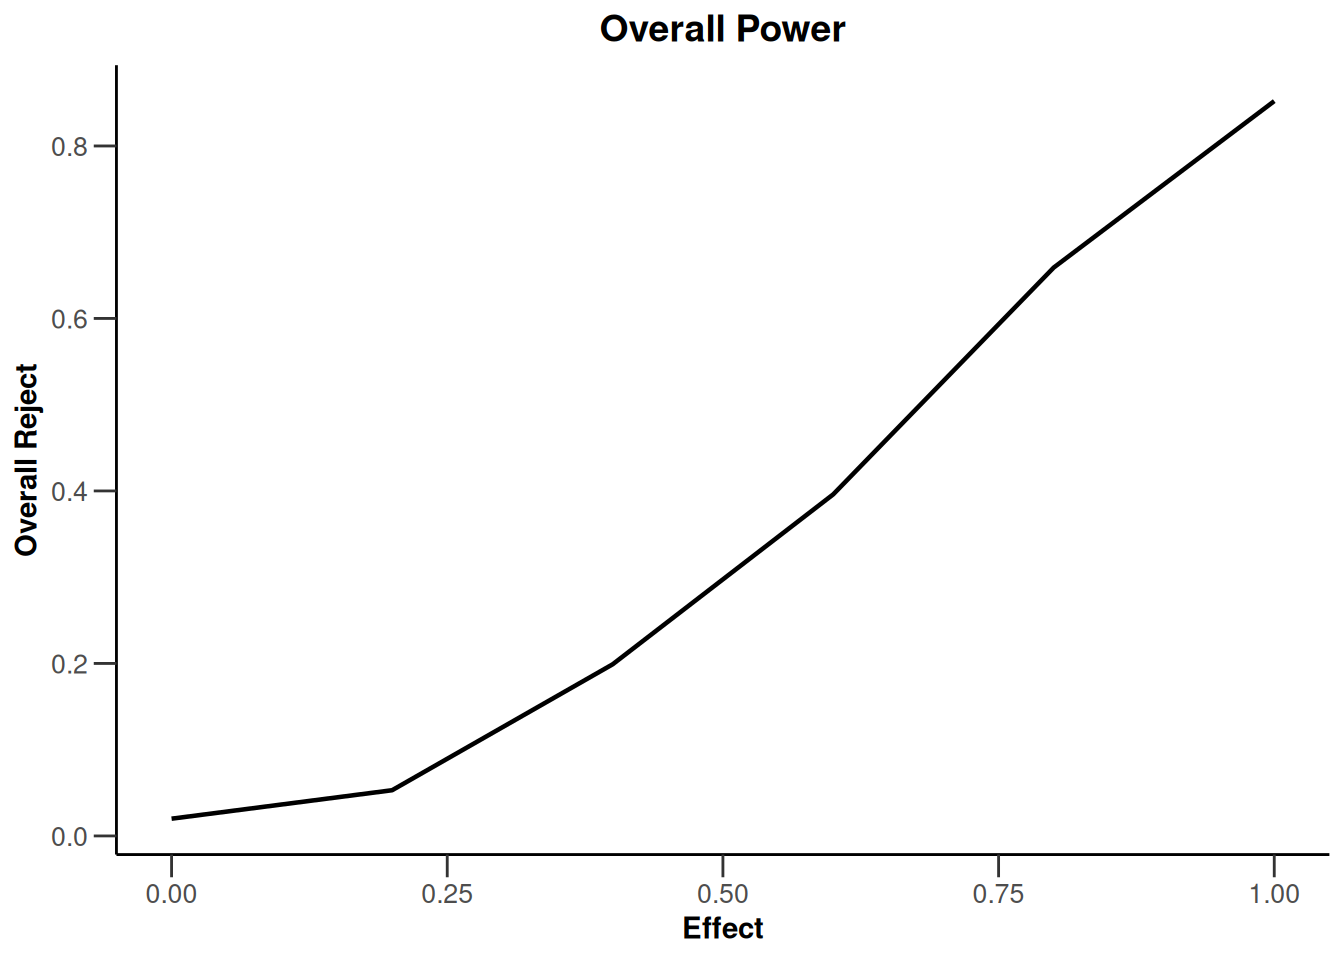
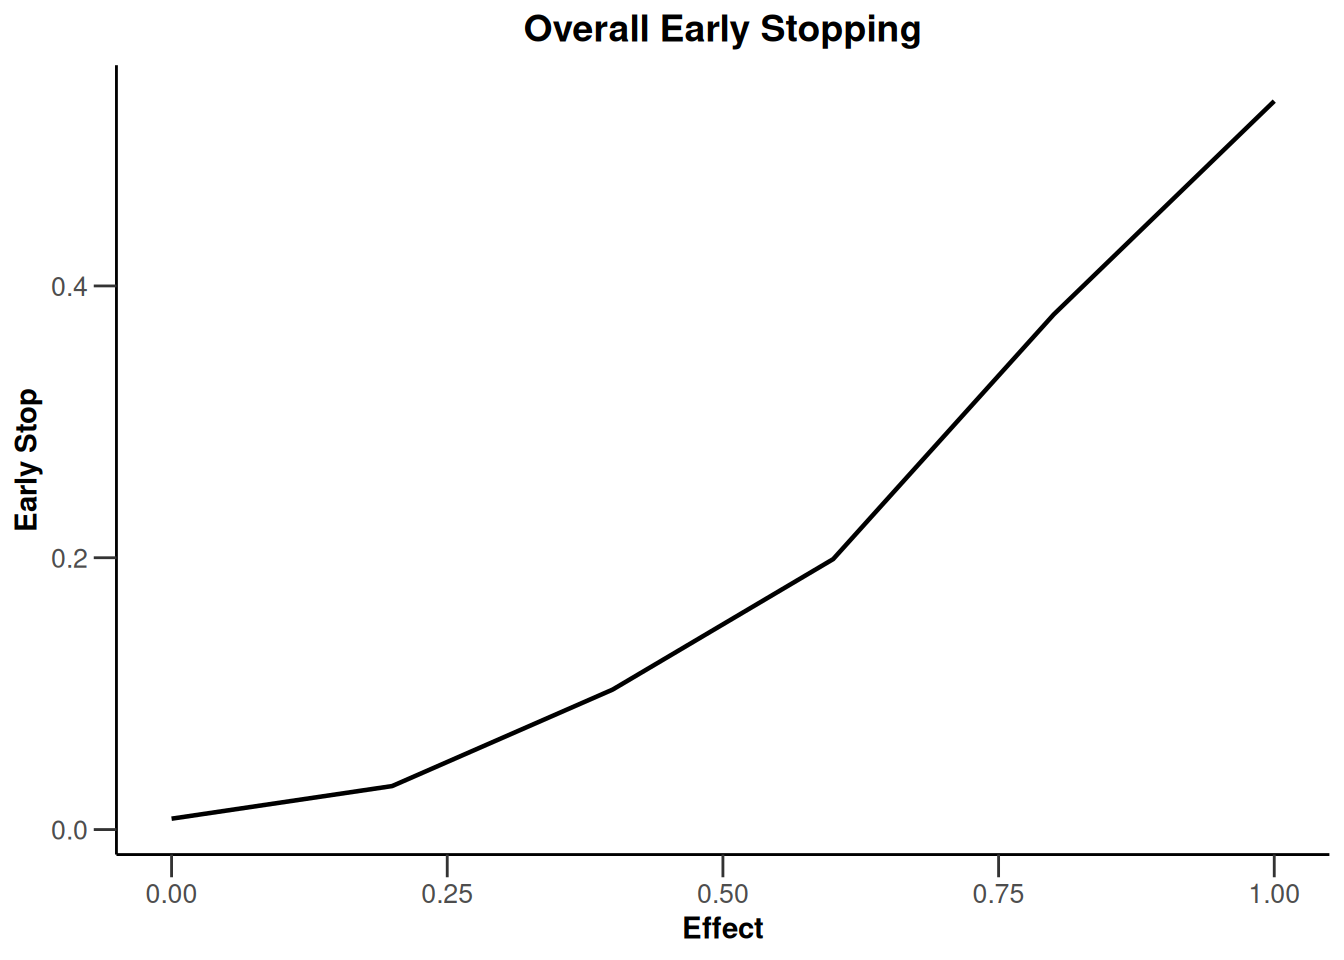
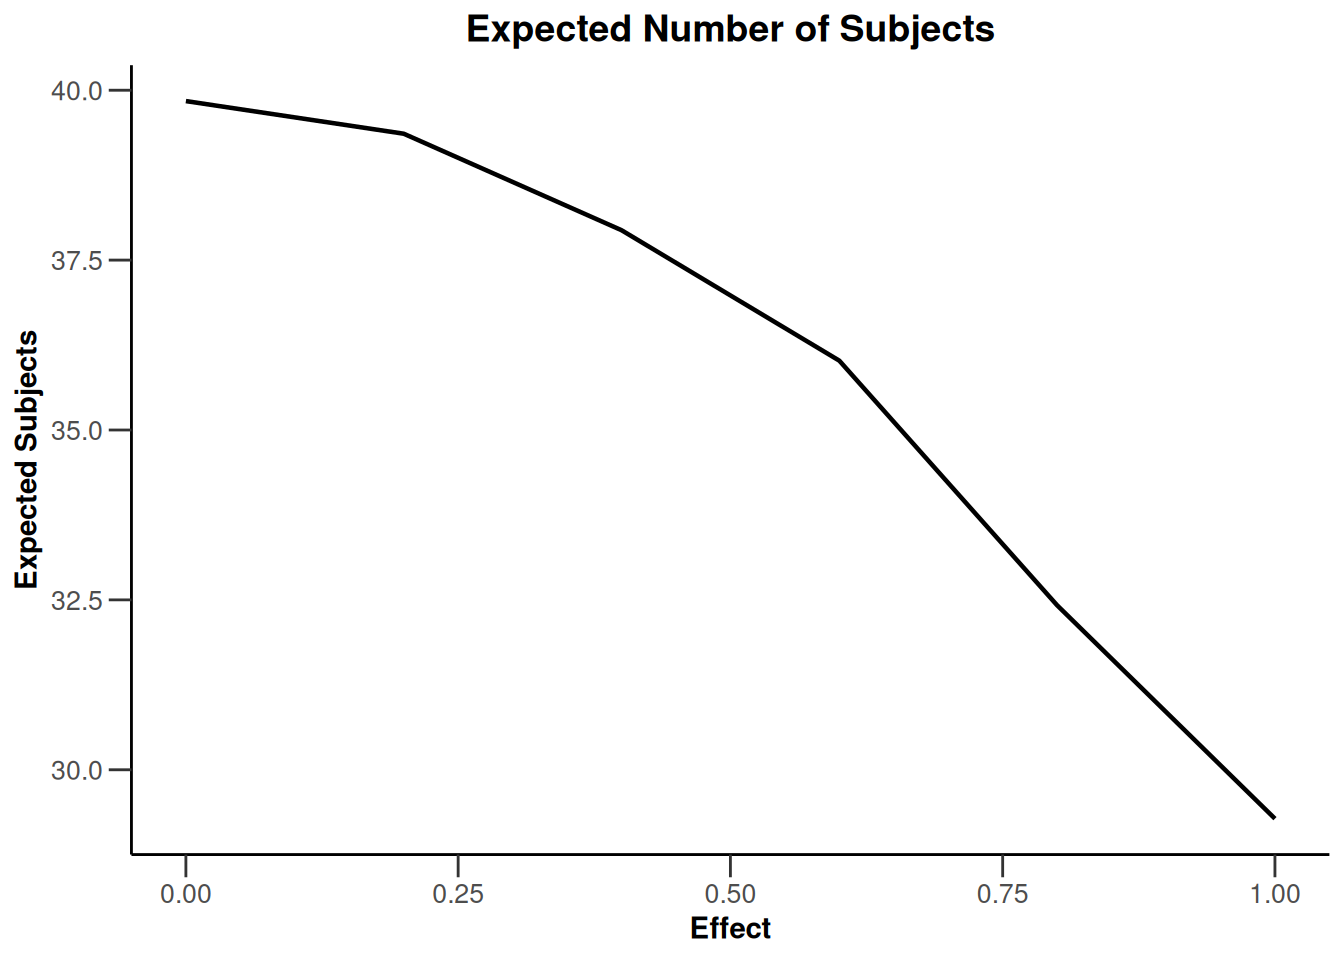
Simulation plots
Simulation means (continuous endpoint)
simulationResults1 <- getSimulationMeans(
    design = getDesignFisher(kMax = 2),
    plannedSubjects = c(20, 40), maxNumberOfIterations = 1000,
    seed = 12345
)

plot(simulationResults1, type = "all", grid = 0)

plot(simulationResults1, type = 4)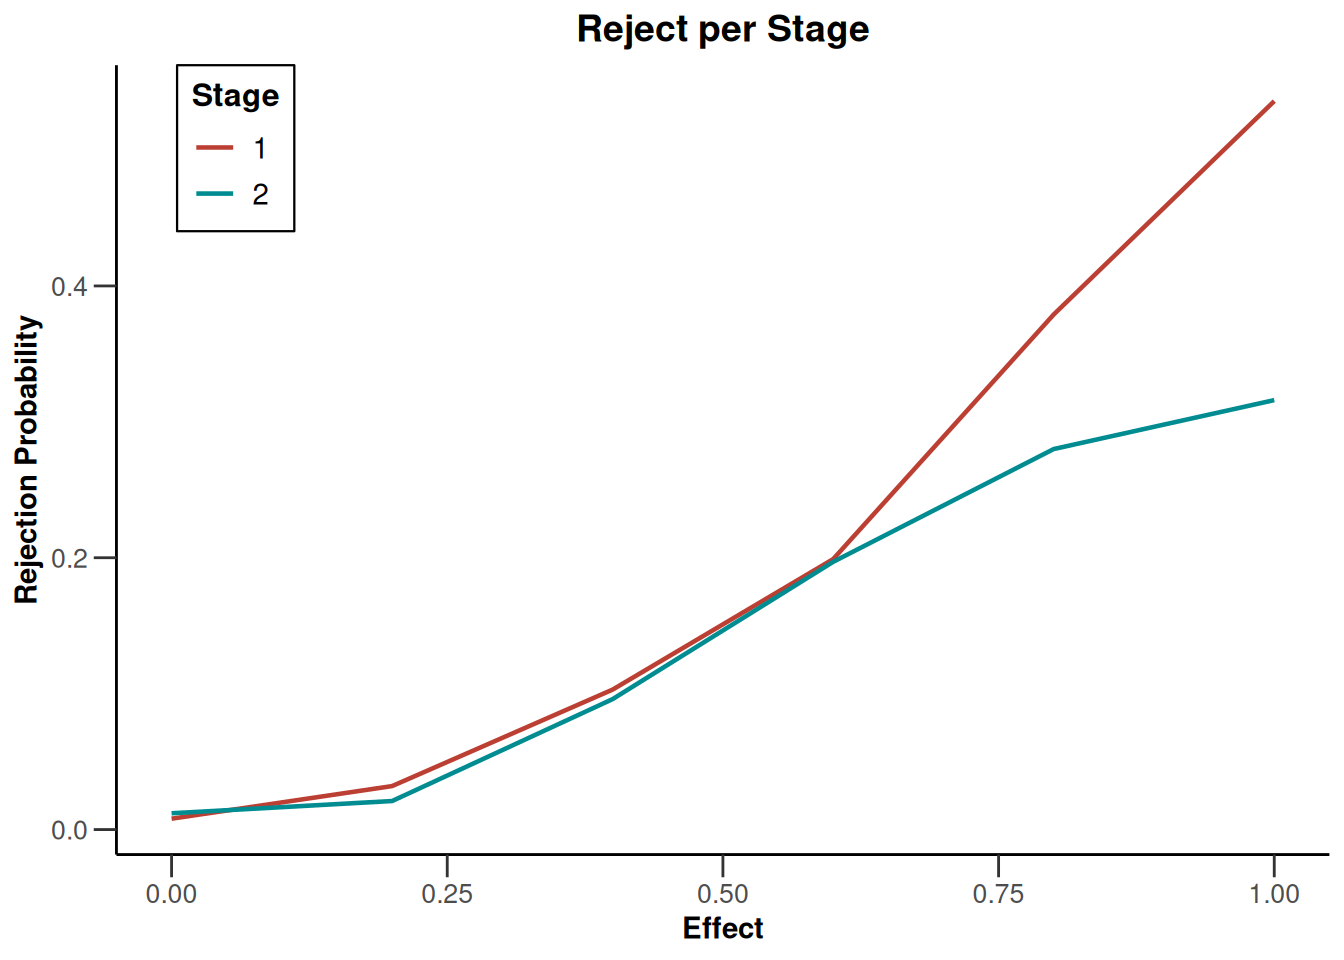
plot(simulationResults1, type = 5)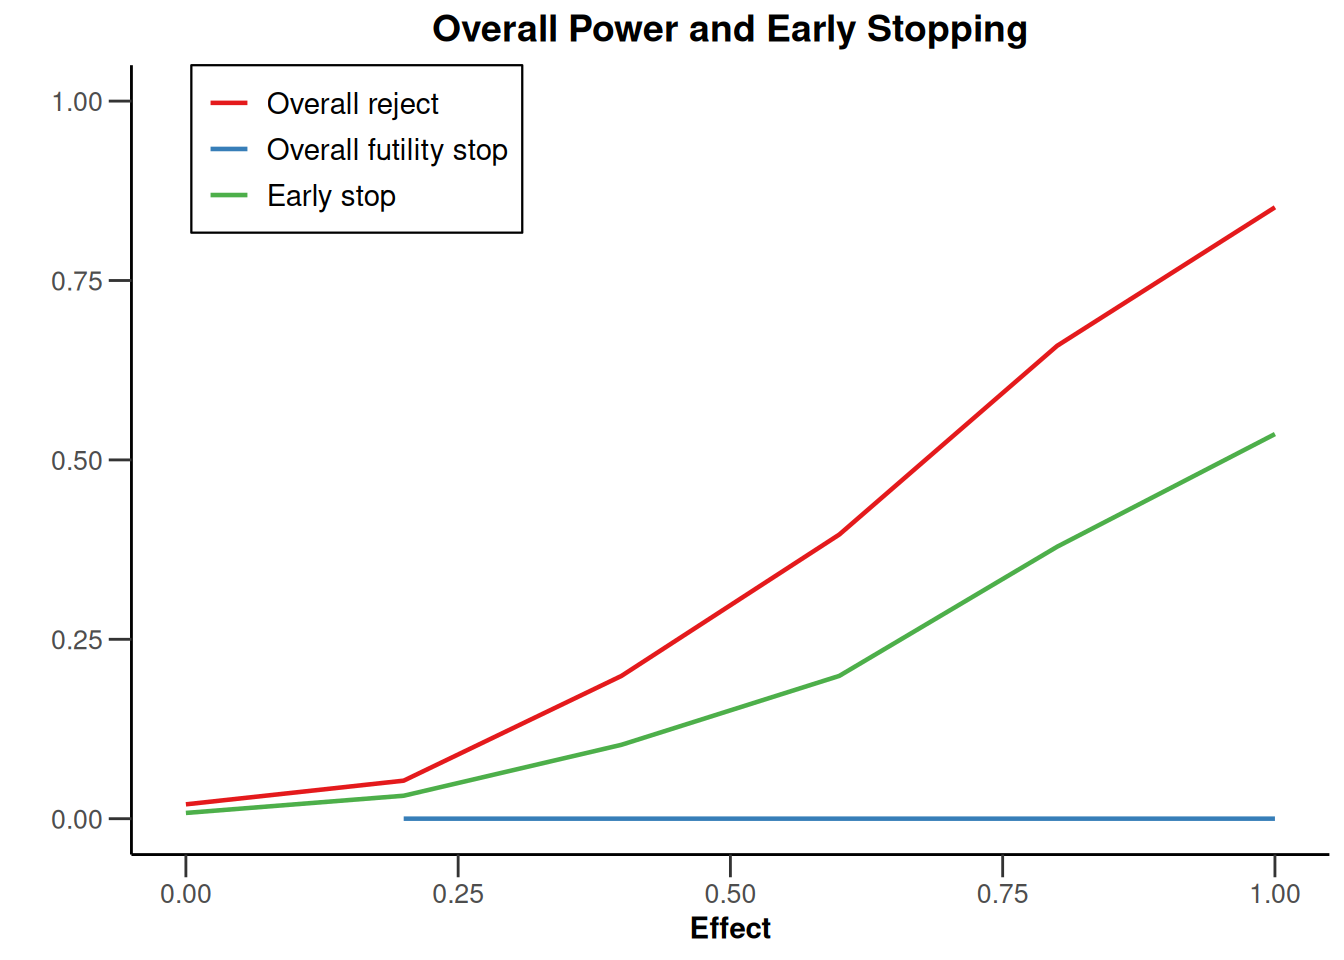
plot(simulationResults1, type = 6)
Simulation rates (binary endpoint)
simulationResults1 <- getSimulationRates(
    design = getDesignFisher(kMax = 2),
    plannedSubjects = c(20, 40), maxNumberOfIterations = 1000,
    seed = 12345
)

plot(simulationResults1, type = 4)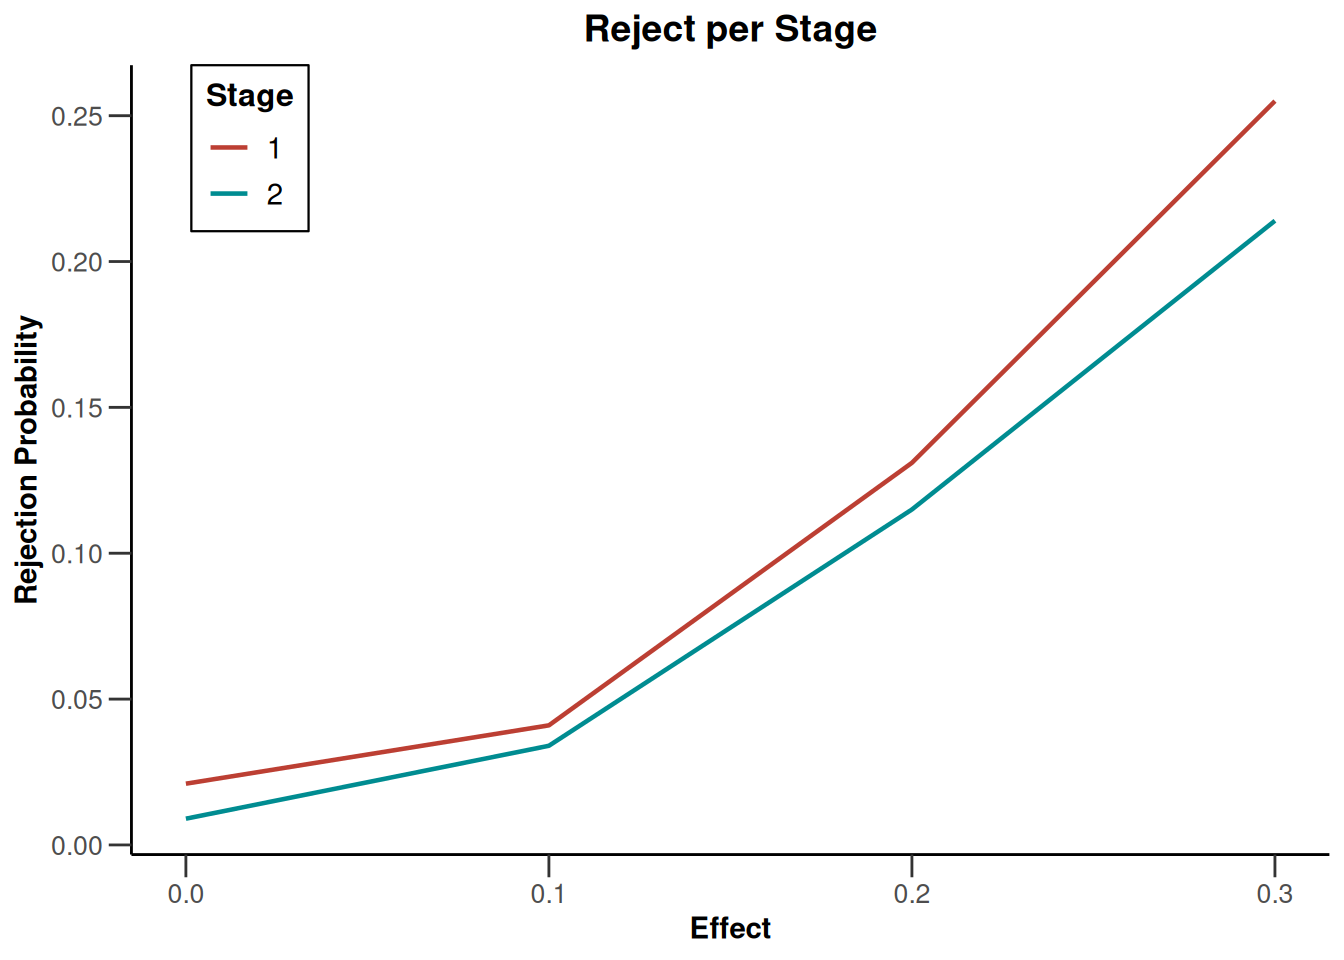
plot(simulationResults1, type = 5)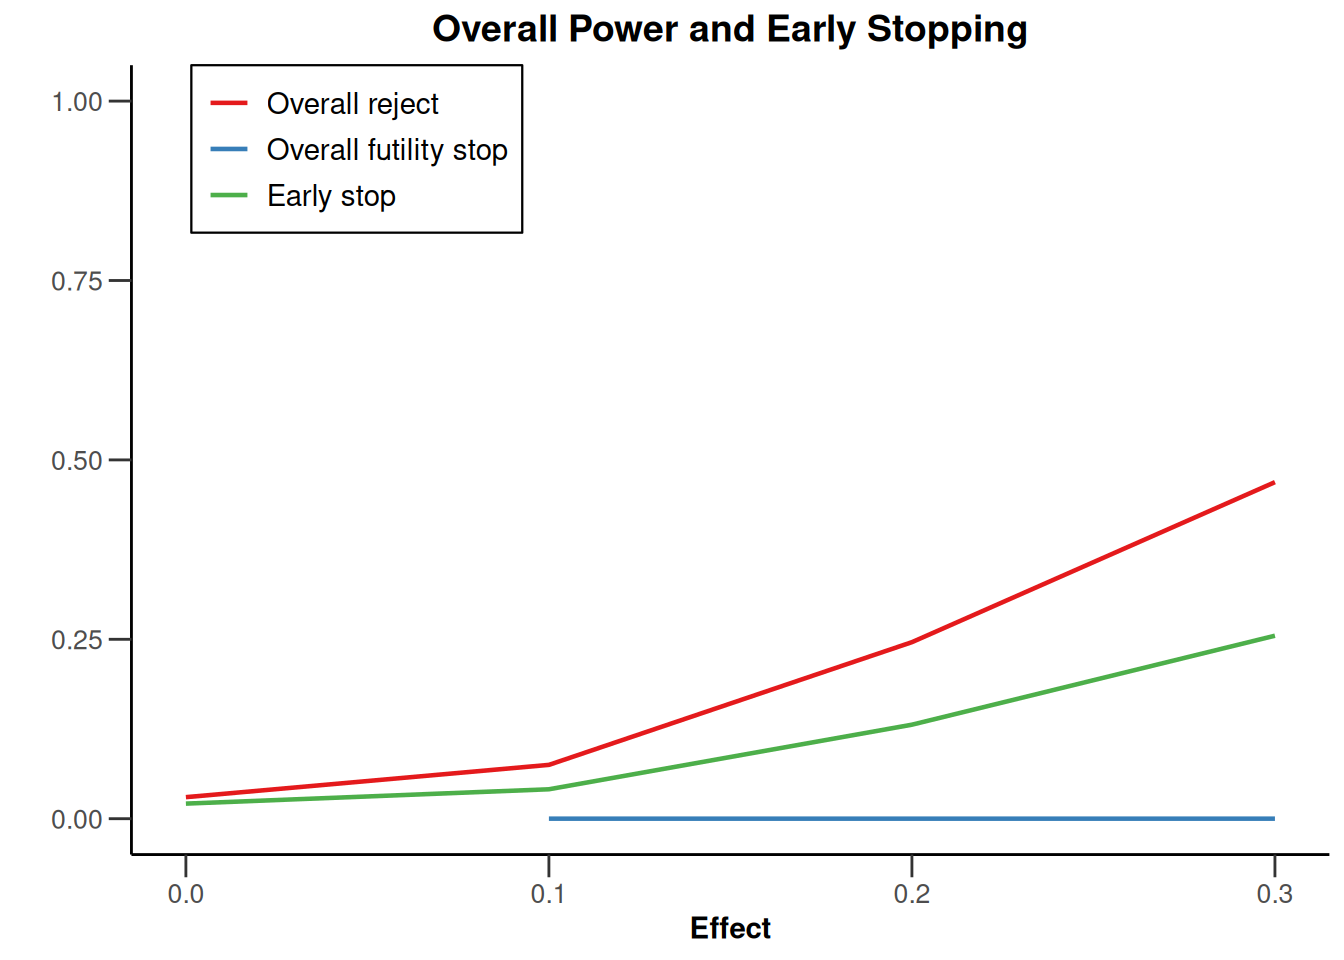
plot(simulationResults1, type = 6)
Simulation plots survival (survival endpoint)
simulationResults1 <- getSimulationSurvival(
    accrualTime = 12,
    maxNumberOfSubjects = 1405,
    plannedEvents = 300, maxNumberOfIterations = 1000,
    seed = 12345
)

plot(simulationResults1, type = 5)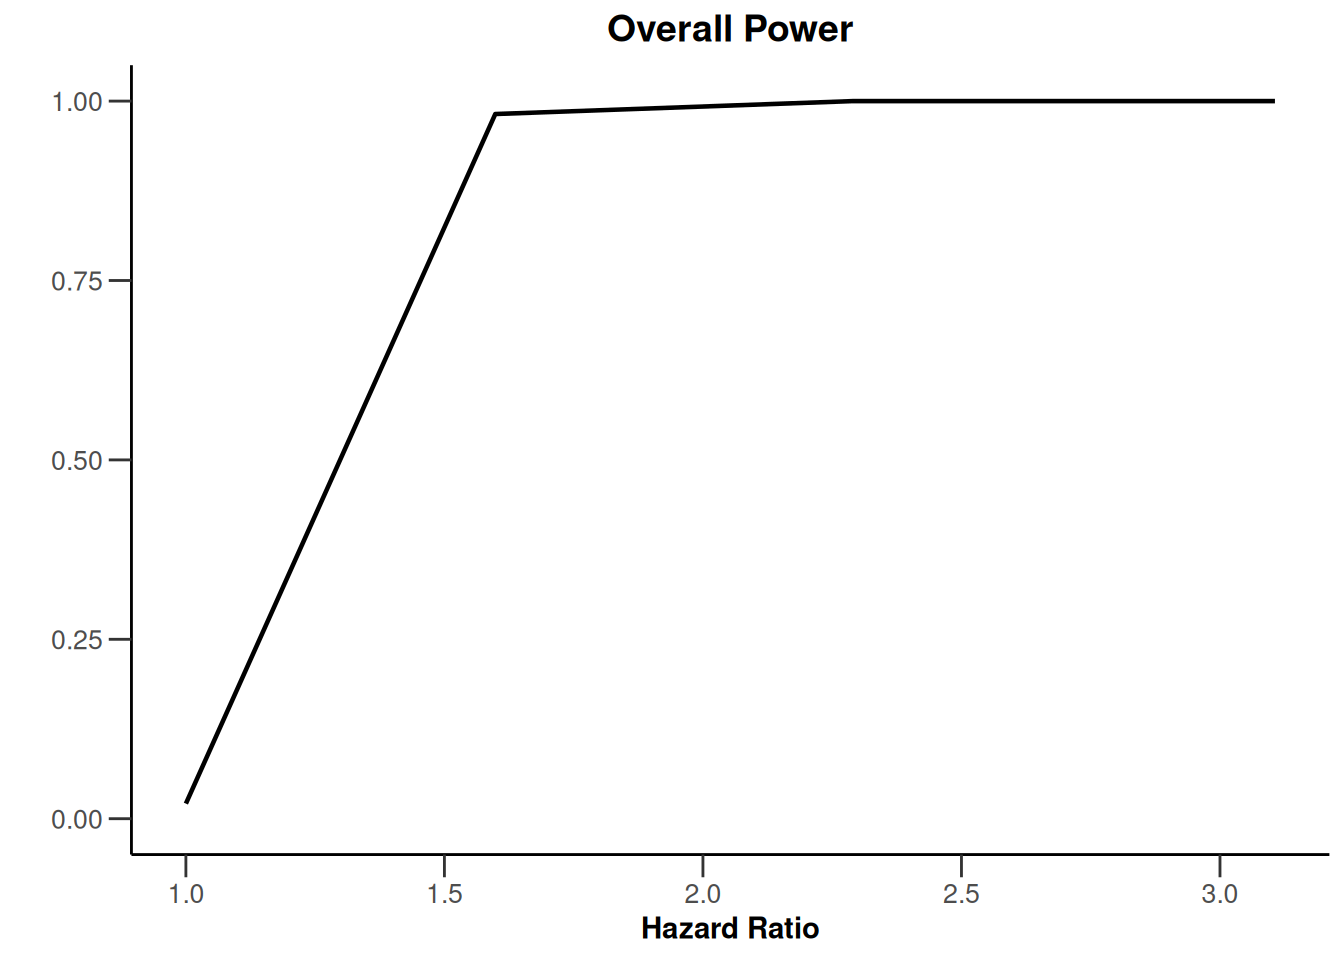
plot(simulationResults1, type = 6)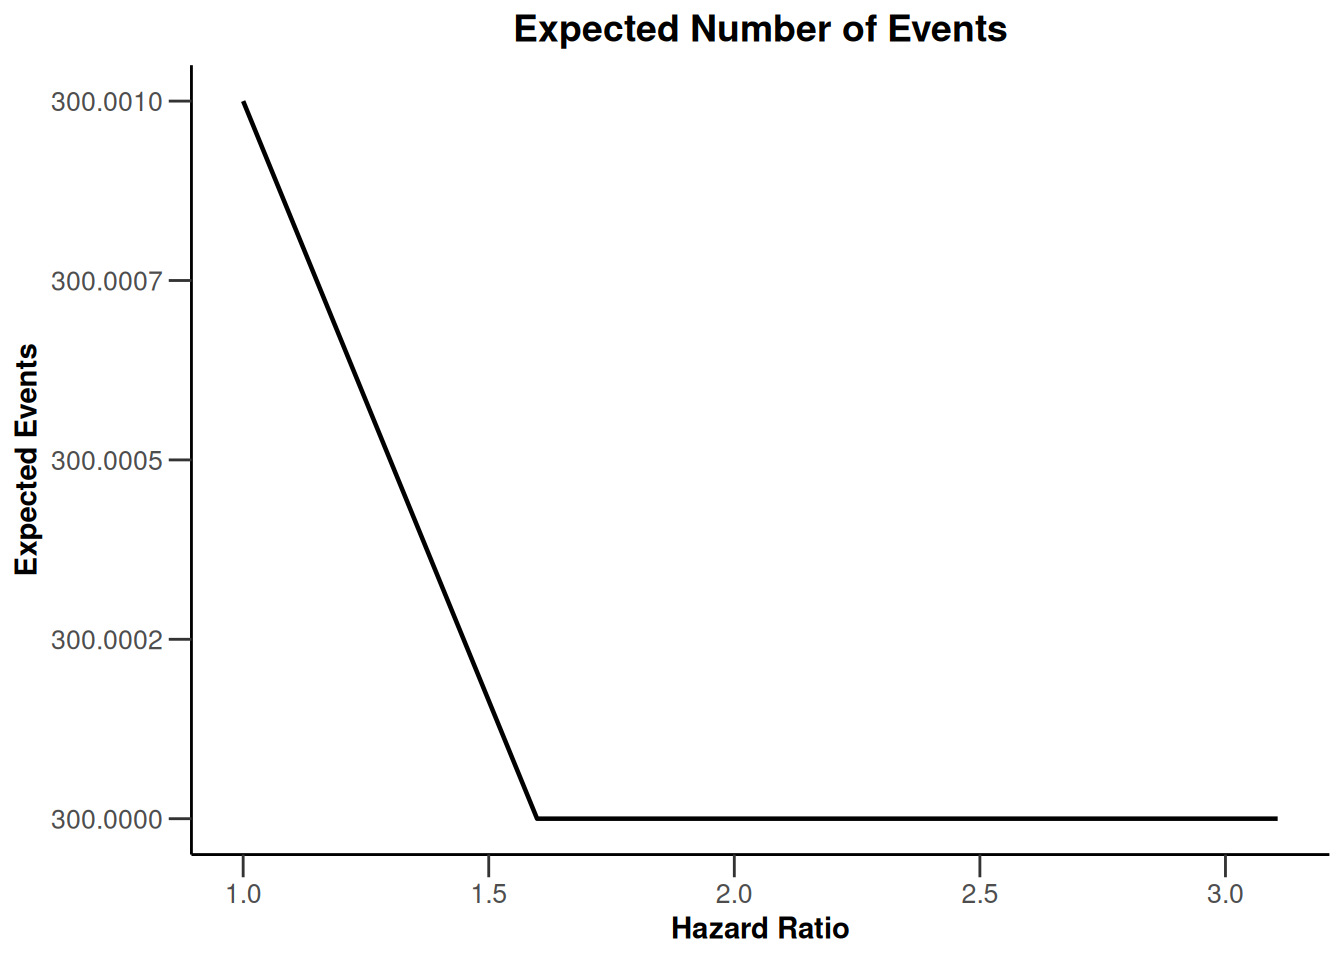
plot(simulationResults1, type = 7)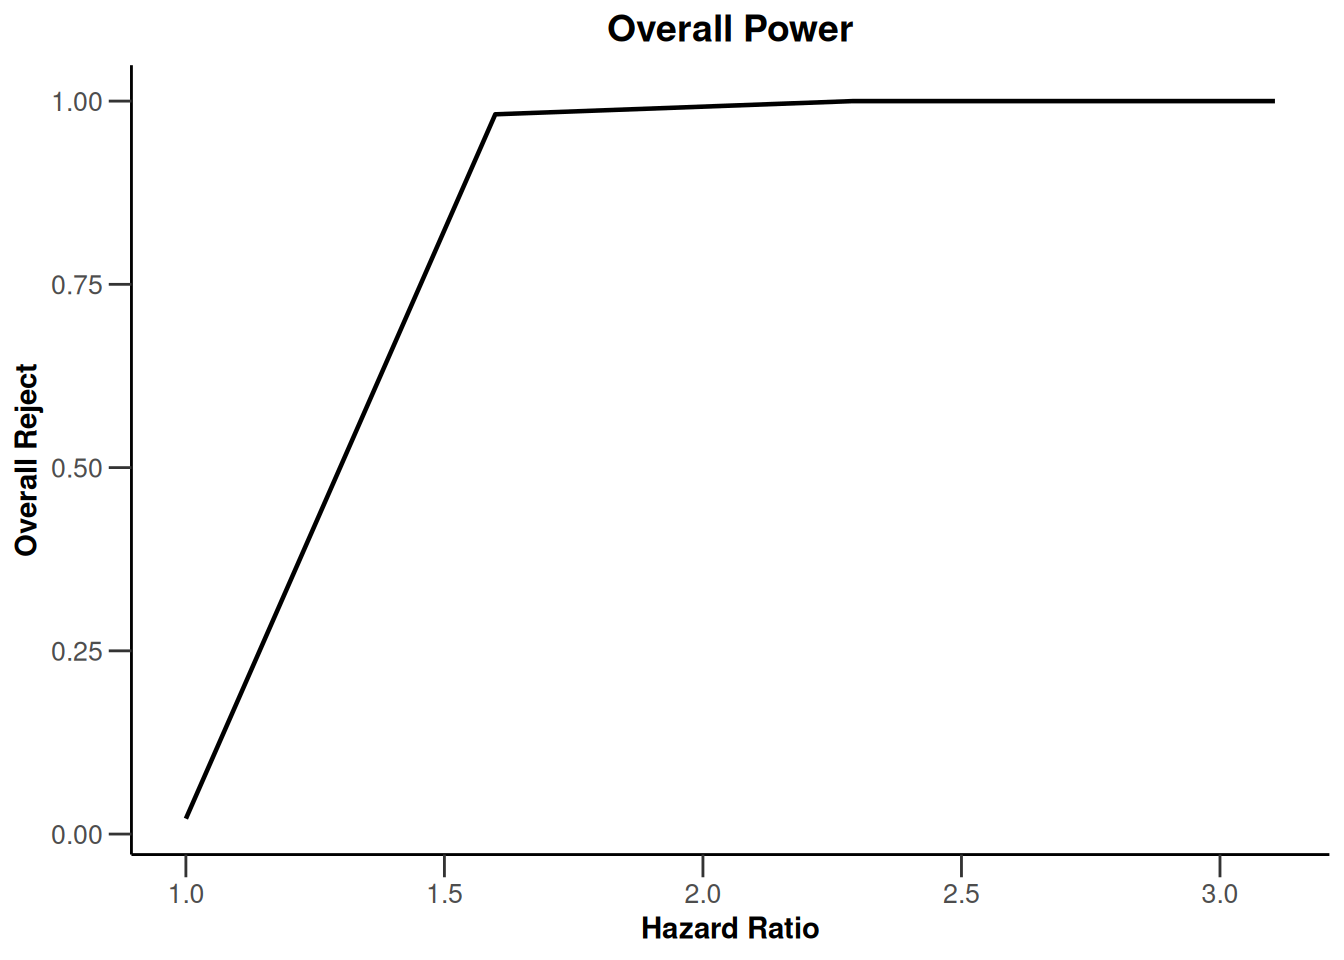
plot(simulationResults1, type = 9)
plot(simulationResults1, type = 10)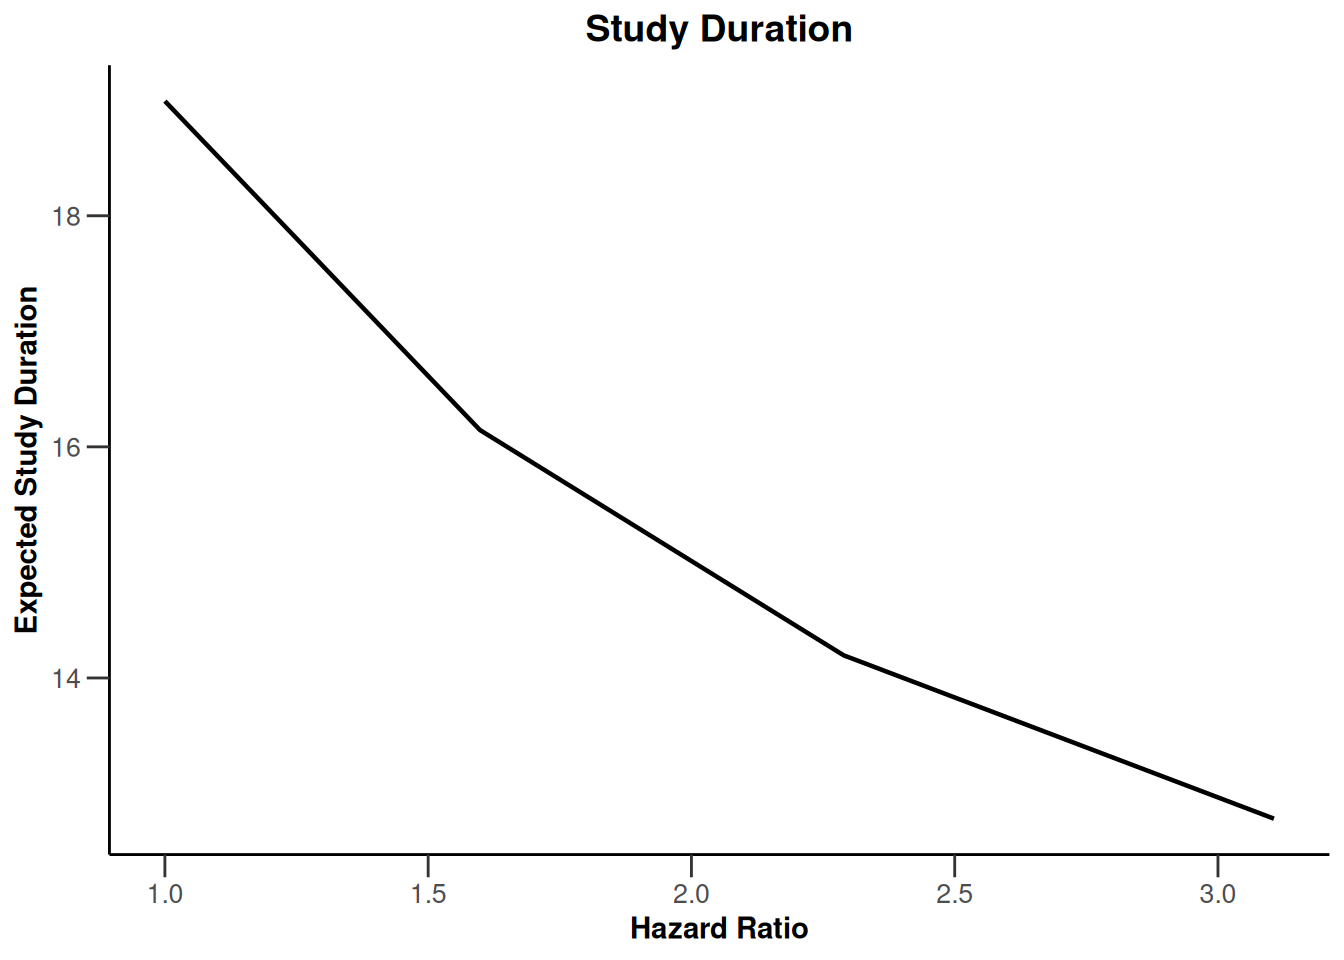
plot(simulationResults1, type = 11)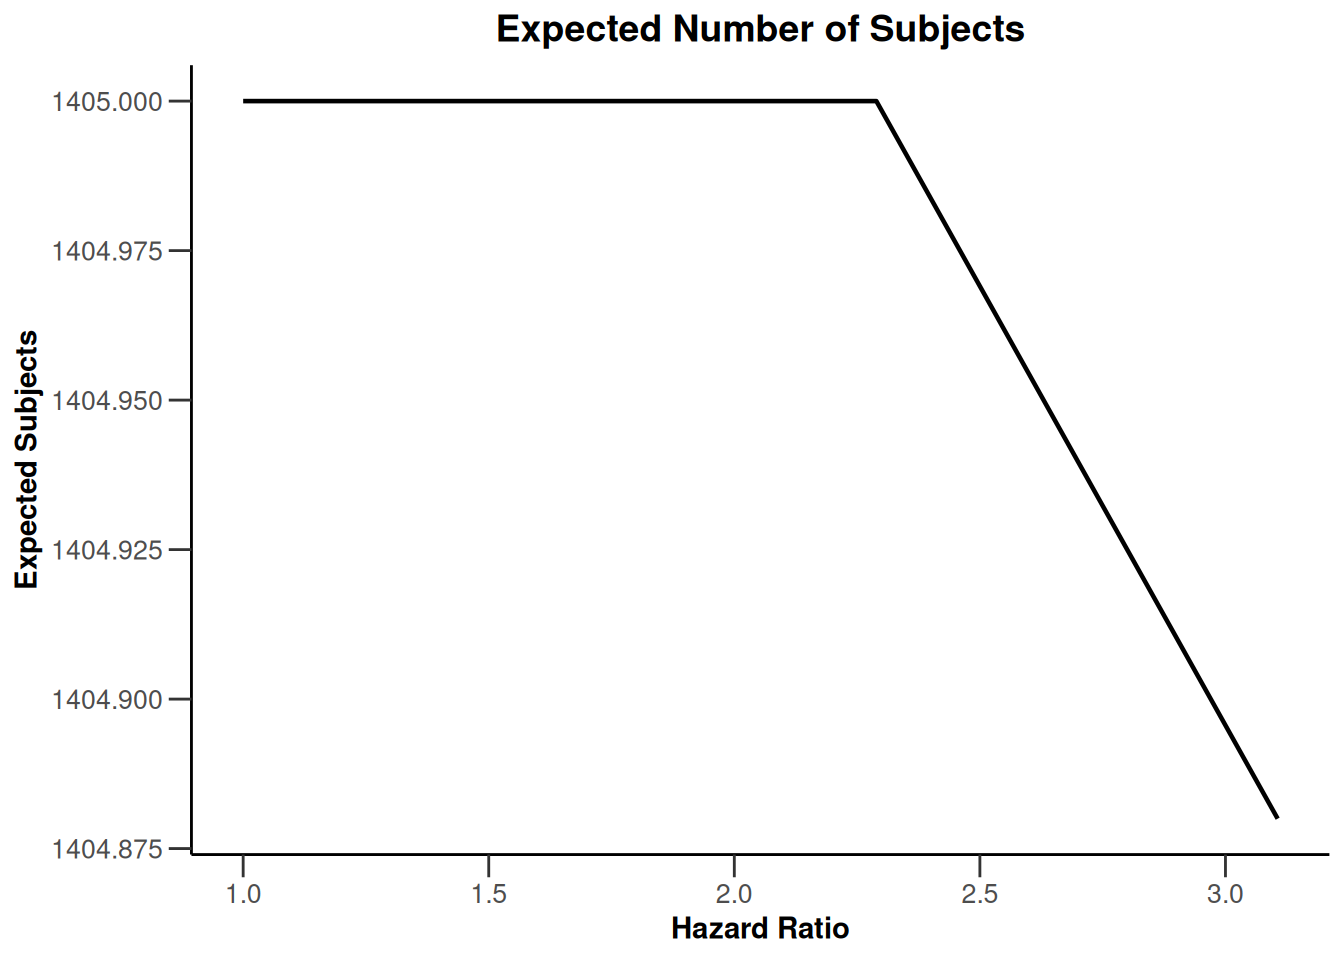
plot(simulationResults1, type = 12)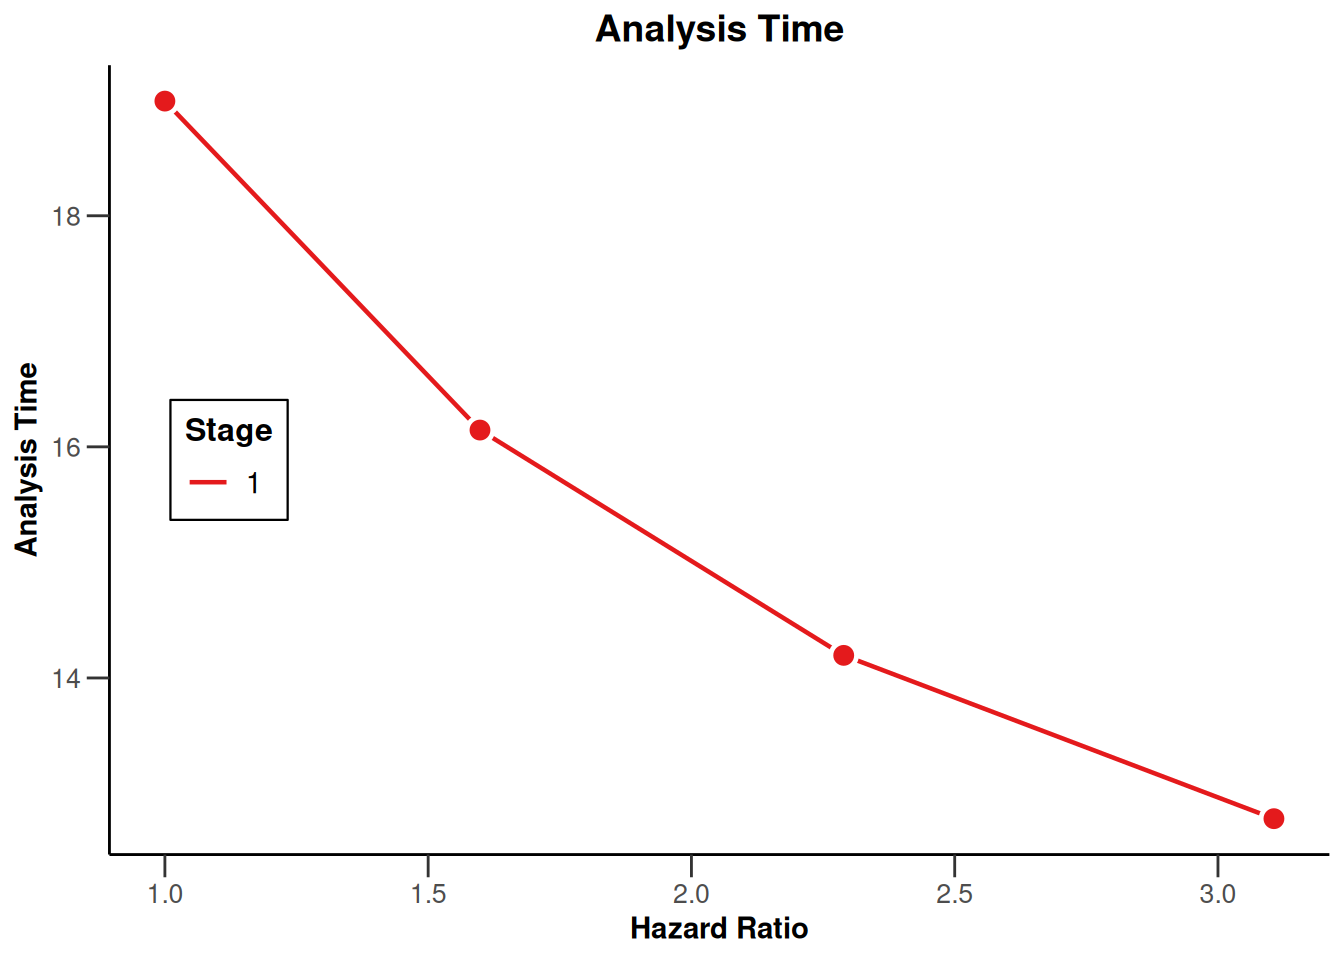
plot(simulationResults1, type = 13)Warning: Only the first 'pi1' (0.2) was used for plotting
plot(simulationResults1, type = 14)Warning: Only the first 'pi1' (0.2) was used for plotting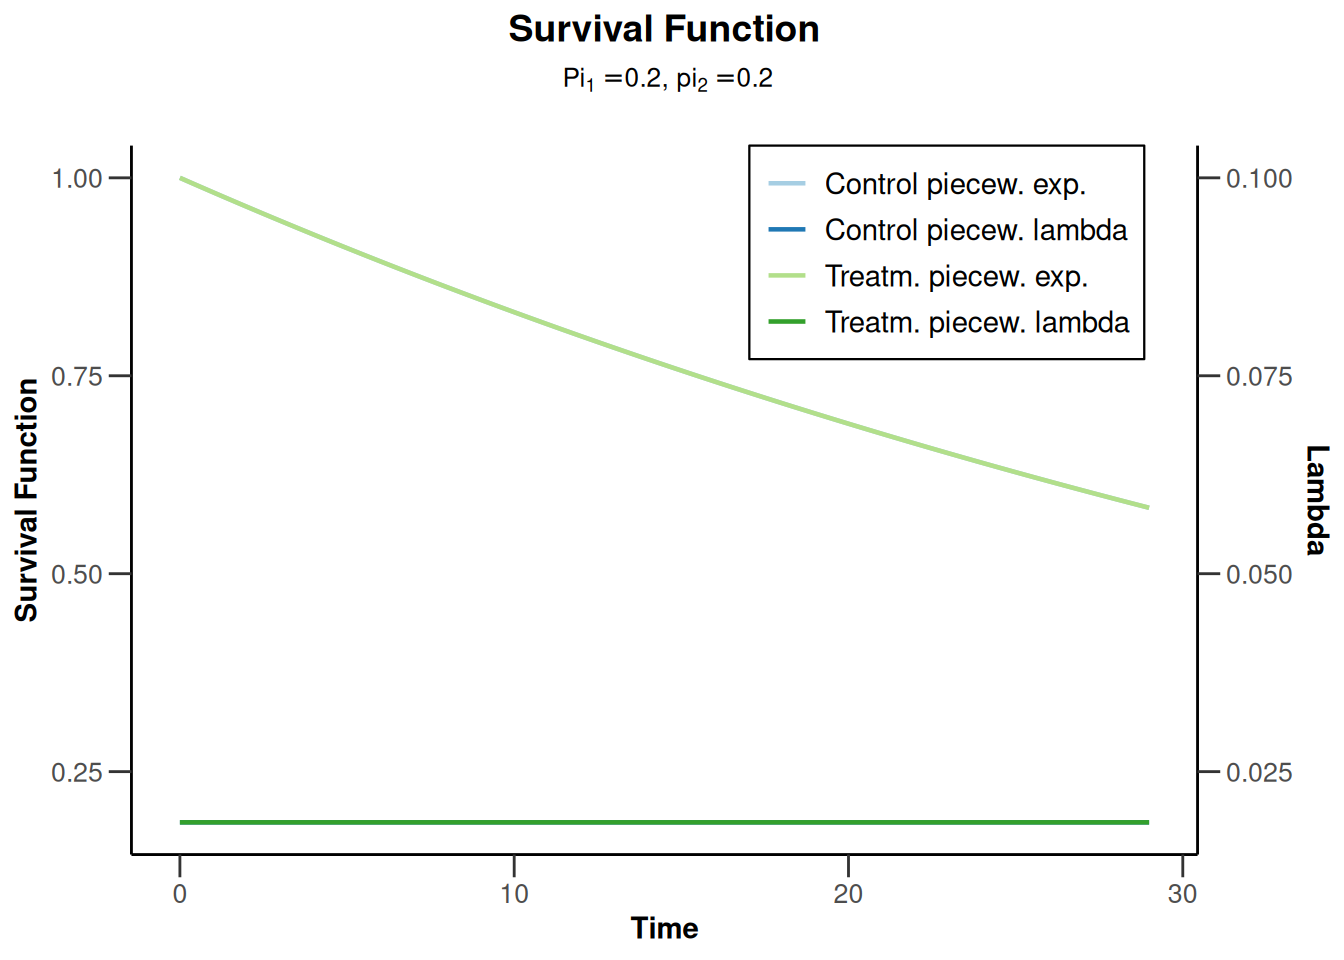
simulationResults2 <- getSimulationSurvival(
    accrualTime = 12,
    lambda2 = 0.03,
    hazardRatio = 0.8,
    maxNumberOfSubjects = 1405,
    plannedEvents = 300, maxNumberOfIterations = 1000,
    seed = 23456
)

plot(simulationResults2, type = 13)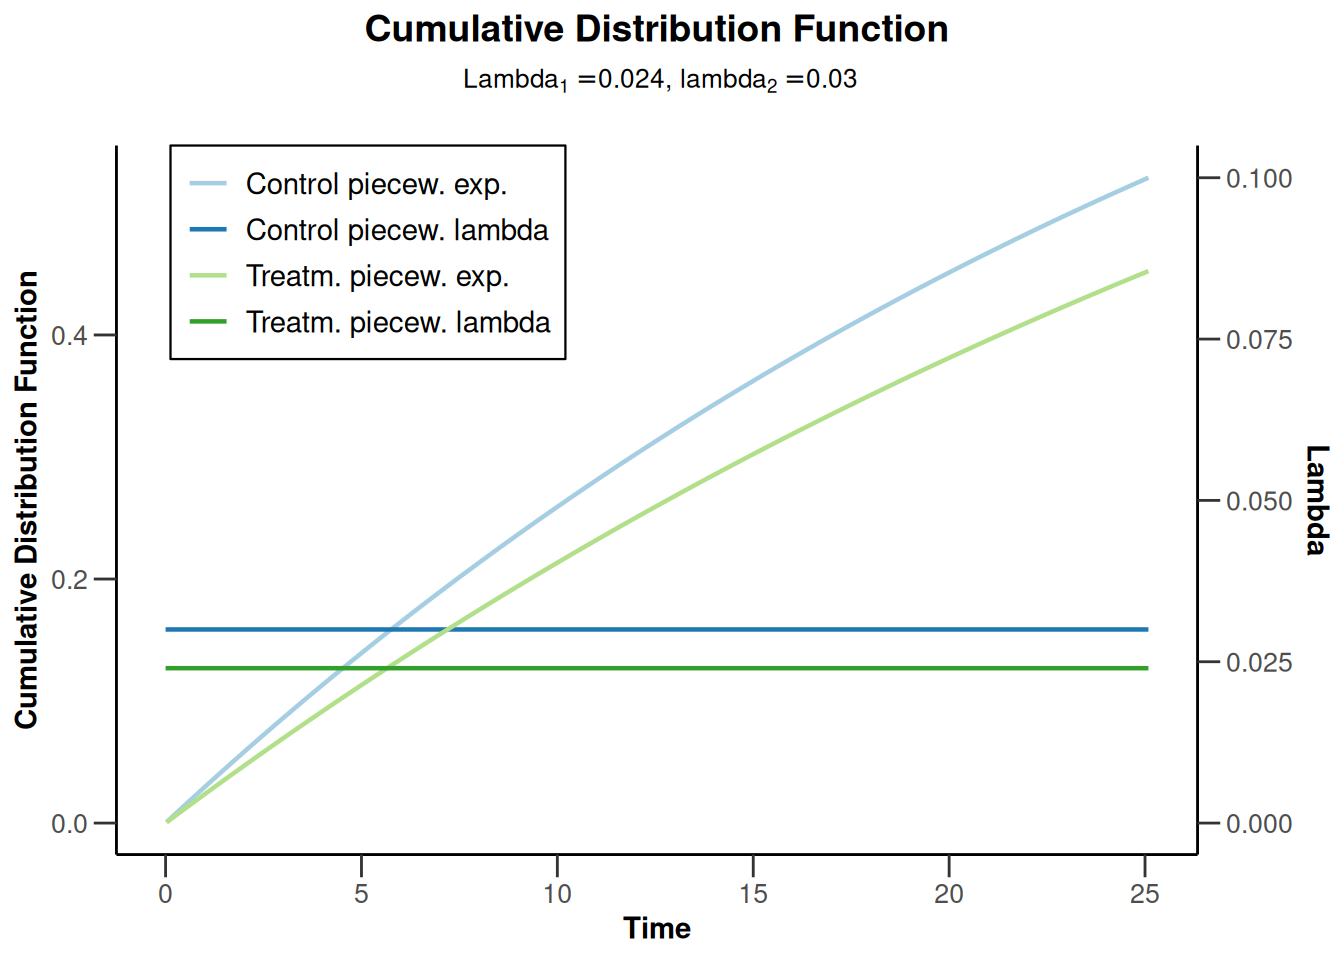
plot(simulationResults2, type = 14)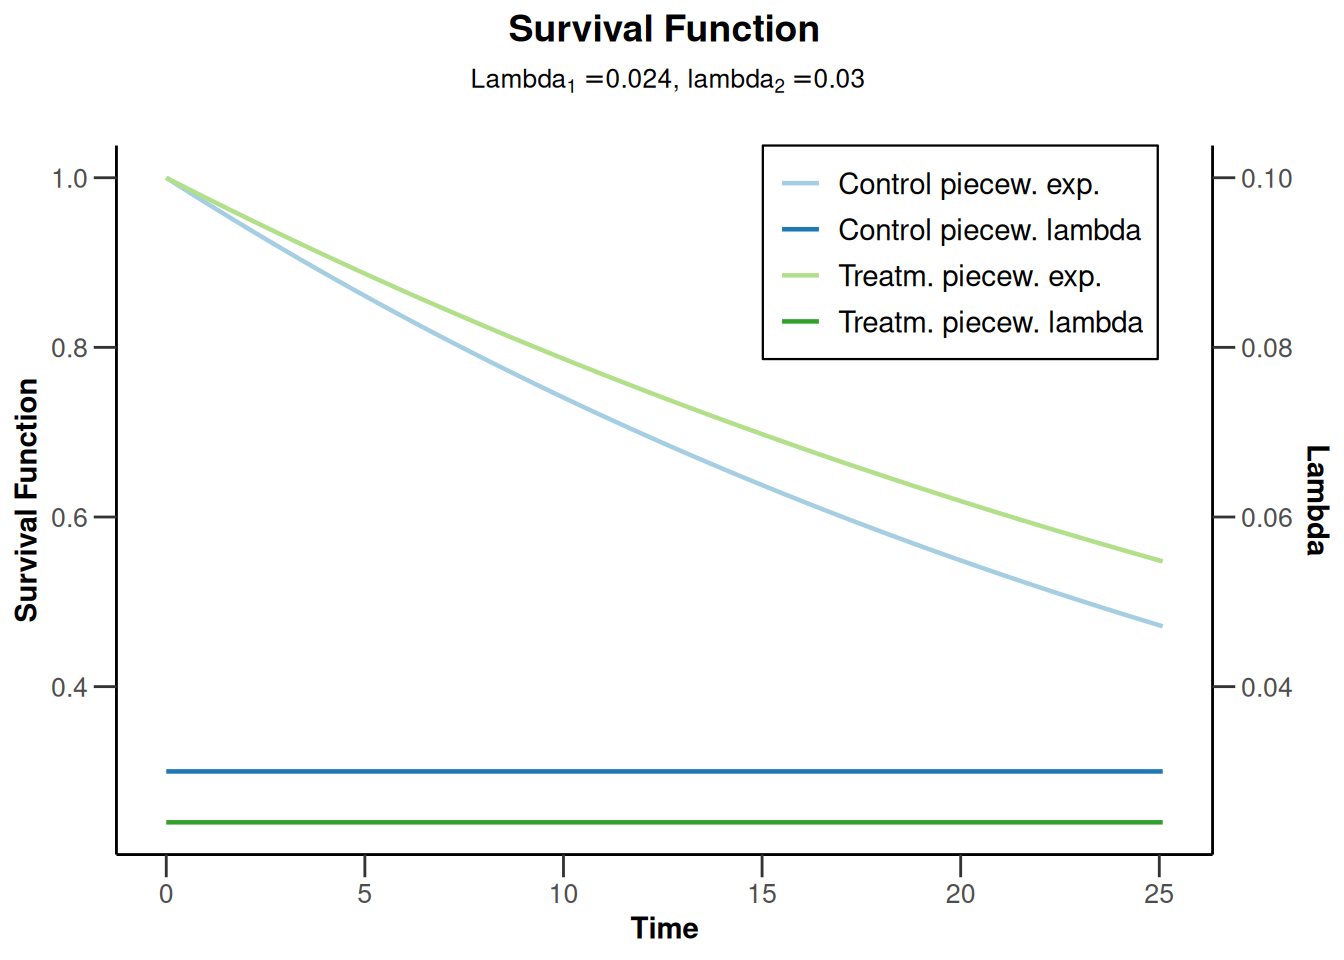
System: rpact 4.0.0, R version 4.3.3 (2024-02-29 ucrt), platform: x86_64-w64-mingw32
To cite R in publications use:
R Core Team (2024). R: A Language and Environment for Statistical Computing. R Foundation for Statistical Computing, Vienna, Austria. https://www.R-project.org/. To cite package ‘rpact’ in publications use:
Wassmer G, Pahlke F (2024). rpact: Confirmatory Adaptive Clinical Trial Design and Analysis. R package version 4.0.0, https://www.rpact.com, https://github.com/rpact-com/rpact, https://rpact-com.github.io/rpact/, https://www.rpact.org.